Marlene King: Social Media + Pop Culture = ? →
I used a Google Chrome incognito window to try to make sure this is ungated. But let me know if you do find it is behind a paywall.
A Partisan Nonpartisan Blog: Cutting Through Confusion Since 2012
I used a Google Chrome incognito window to try to make sure this is ungated. But let me know if you do find it is behind a paywall.
Like many other readers, I was fascinated by Richard Dawkins introduction of the idea of a meme in his book The Selfish Gene.

Wikipedia gives a good discussion of memes:
A meme (/ˈmiːm/; meem)[1] is “an idea, behavior, or style that spreads from person to person within a culture.”[2] A meme acts as a unit for carrying cultural ideas, symbols, or practices that can be transmitted from one mind to another through writing, speech, gestures, rituals, or other imitable phenomena. Supporters of the concept regard memes as cultural analogues to genes in that they self-replicate, mutate, and respond to selective pressures.[3]
The word meme is a shortening (modeled on gene) of mimeme (from Ancient Greek μίμημα Greek pronunciation: [míːmɛːma]mīmēma, “imitated thing”, from μιμεῖσθαι mimeisthai, “to imitate”, from μῖμος mimos "mime")[4] and it was coined by the British evolutionary biologist Richard Dawkins in The Selfish Gene (1976)[1][5] as a concept for discussion of evolutionary principles in explaining the spread of ideas and cultural phenomena. Examples of memes given in the book included melodies, catch-phrases, fashion, and the technology of building arches.[6]
Proponents theorize that memes may evolve by natural selection in a manner analogous to that of biological evolution. Memes do this through the processes of variation, mutation, competition, and inheritance, each of which influence a meme’s reproductive success. Memes spread through the behavior that they generate in their hosts. Memes that propagate less prolifically may become extinct, while others may survive, spread, and (for better or for worse) mutate. Memes that replicate most effectively enjoy more success, and some may replicate effectively even when they prove to be detrimental to the welfare of their hosts.[7]
A field of study called memetics[8] arose in the 1990s to explore the concepts and transmission of memes in terms of an evolutionary model.
Internet memes are a subset of memes in general. Wikipedia has a good discussion of this particular subset of memes as well:
An Internet meme may take the form of an image, hyperlink, video, picture, website, or hashtag. It may be just a word or phrase, including an intentional misspelling. These small movements tend to spread from person to person via social networks, blogs, direct email, or news sources. They may relate to various existing Internet cultures or subcultures, often created or spread on sites such as 4chan, Reddit and numerous others.
An Internet meme may stay the same or may evolve over time, by chance or through commentary, imitations, parody, or by incorporating news accounts about itself. Internet memes can evolve and spread extremely rapidly, sometimes reaching world-wide popularity within a few days. Internet memes usually are formed from some social interaction, pop culture reference, or situations people often find themselves in. Their rapid growth and impact has caught the attention of both researchers and industry.[3]Academically, researchers model how they evolve and predict which memes will survive and spread throughout the Web. Commercially, they are used in viral marketing where they are an inexpensive form of mass advertising.
But sometimes our image of an internet meme is too narrow. A tweet can easily become an internet meme if it is retweeted and modified. Thinking of bigger chunks of text, even a blog post sometimes both spreads in its original form and inspires other blog posts that can be considered mutated forms of the original blog post. And thinking just a bit smaller than a tweet, a link to a blog post can definitely be a meme, coevolving with different combinations of surrounding text recommending or denigrating what is at the link–sometimes just the surrounding text of a tweet and sometimes the surrounding text of an entire blog post that flags what is at the link. So those of us who care how many people read what we have to say have reason to be interested in the principles that determine when tweet, a post or a link will be contagious or not. In other words, what does it take to go viral?
Jonah Berger’s book Contagious gives answers based on research Jonah has done as a Marketing professor at the Wharton school. Jonah identifies six dimensions of a message that make it more likely to spread. Here are my notes what Jonah has to say about those six dimensions, for which Jonah gives the acronym STEPPS:
1. Social Currency: We share things that make us look good.
Jonah emphasizes three ways to make people want to share something in order to look good.
2. Triggers: Top of mind, tip of tongue.
Here the key idea is to tie what you are trying to promote to some trigger that will happen often in someone’s environment.

3. Emotion: When we care, we share.
The non-obvious finding here is that high arousal emotions such as
–regardless of whether they are positive or negative–encourage sharing more than low arousal emotions such as contentment and sadness. Indeed, arousal is so important for sharing, experiments indicate that even the physiological arousal induced by making people run in place can cause people to share an article more often.
To find the emotional core of an idea, so that emotional core can be highlighted, Jonah endorses the technique of asking why you think people are doing something, then asking “why is that important” three times. Of course, this could also be seen as a way to try to get at the underlying utility function: utility functions are implemented in important measure by emotions.
Jonah recommends Google’s “Paris Love” campaign as an example of showing how to demonstrate that something seemingly prosaic, such as search, can connect to deeper concerns.
4. Public: Built to show, built to grow.
Here I like the story of how Steve Jobs and his marketing expert Ken Segall decided that making the Apple log on a laptop look right-side up to other people when the laptop is in use was more important than making it look right-side up to the user at the moment of figuring out which way to turn to laptop to open it up. Jonah points out how the way the color yellow made them stand out helped make Livestrong wristbands a thing in the days before Lance Armstrong was disgraced

and how the color white made ipod headphones more noticeable than black would have.

Jonah also makes interesting points about how talking about certain kinds of bad behavior, by making it seem everyone is doing it, can actually encourage bad behavior. Think of Nancy Reagan’s “Just Say No” antidrug campaign:

An alternative is to try to highlight the alternative, desired behavior.
5. Practical Value: News you can use.
This dimension is fairly straightforward. But Jonah gives this interesting example of a video about how to shuck corn for corn on the cob that went viral in an older demographic where not many things go viral. He also points to the impulse to share information of presumed practical value as part of the reason it is so hard to eradicate the scientifically discredited idea that vaccines cause autism.
6. Stories: Information travels under the guise of idle chatter.
Here, Jonah uses the example of the Trojan horse, which works well on many levels: the horse brought Greek warriors into Troy, and the story of the Trojan horse brings the idea “never trust your enemies, even if they seem friendly” deep into the soul. He points out just how much information is carried along by good stories.
But Jonah cautions that to make a story valuable, what you are trying to promote has to be integral to the story. Crashing the Olympics and doing a belly flop makes a good story, but the advertising on the break-in diver’s outfit was not central to the story and was soon forgotten. By contrast, for Panda brand Cheese, the Panda backing up the threat “Never say no to Panda” is a memorable part of the stories of Panda mayhem in the cheese commercials, and Dove products at least have an integral supporting role to play in Dove’s memorable Evolution commercial illustrating the extent to which much makeup and photoshopping are behind salient images of beauty in our environment.
Here are a few thought about how to use Jonah’s insights in trying to make a mark in the blogosphere and tweetosphere.
1. Social Currency
Inner Remarkability: I find the effort to encapsulate the inner remarkability of each post or idea in a tweet an interesting intellectual challenge. One good way to practice this is a tip I learned from Bonnie Kavoussi: try to find the most interesting quotation from someone else’s post and put that quotation in your tweet. That will win you friends from the authors of the posts, earn you more Twitter followers (remember that the author of the post will have a strong urge to retweet if you are advertising herhis post well), and hone your skills for when you want to advertise your own posts on Twitter.
Leverage Game Mechanics: In the blogosphere and on Twitter, we are associating with peers. Much of what they want is similar to what w want–to be noticed, to get our points across, to get new ideas. So helping them to win their game is basically a matter of being a good friend or colleague. For example, championing people’s best work and being generous in giving credit will win points.
Make People Feel Like Insiders: When writing for on online magazine (Quartz in my case), it feels I need to write as if the readers are reading me for the first time. By contrast, a blog is tailor-made to make readers feel like insiders. So it is valuable to have an independent blog alongside any writing I do for an online magazine.
2. Triggers
A common piece of advice to young tenure-track assistant professors is to do enough of one thing to become known for that thing. This is consistent with Jonah’s advice about triggers. Having people think of you every time a particular topic comes up is a good way to make sure people think of you. That doesn’t mean you need to be a Johnny-one-note, but it does mean the danger of being seen as a Johnny-one-note is overrated. Remember that readers can easily get variety by diversifying their reading between you and other bloggers. So they will be fine even if your blog specializes to one particular niche, or a small set of niches.
On Twitter, one way to associate yourself with a particular trigger is to use a hashtag. In addition to the hashtag #ImmigrationTweetDay that Adam Ozimek, Noah Smith and I created for Immigration Tweet Day, I have made frequent use of the hashtag #emoney, and I created the hashtag #nakedausterity.
3. Emotion
Economists often want to come across as cool and rational. But many of the most successful bloggers have quite a bit of emotion in their posts and tweets. I think Noah Smith’s blog Noahpinion is a good example of this. Noahpinion delivers humor, indignation, awe, and even the sense of anxiety that comes from watching him attack and wondering how the object of his attack will respond.
One simple aid to getting an emotional kick that both Noah and I use is to put illustrations at the top of most of our blog posts. I think more blogs would benefit from putting well-chosen illustrations at the top of posts.
4. Public
The secret to making a blog more public is simple: Twitter. Everything on Twitter is public, and every interaction with someone who has followers you don’t is a chance for someone new to realize you exist. Of course, you need to be saying something that will make people want to follow you once they notice that you exist.
Facebook helps too. I post links to my blog posts on my Facebook wall and have friended many economists.
Finally, the dueling blog posts in an online debate tend to attract attention.
5. Practical Value
In “Top 25 All-Time Posts and All 22 Quartz Columns in Order of Popularity, as of May 5, 2013,” I point out the two posts that are slowly and steadily gaining on posts that were faster out of the block:
I think the reason is practical value. Economists love to understand the economy, but they also have to teach school. They are glad for help and advice for that task.
6. Stories
Let me make the following argument:
Thus, to make a good story for your blog, it is important to “let people in.” That is, it pays off to let people get to know you. The challenge is then to let people get to know you without making them think you are so “full of yourself” that they flee in disgust. Economists as a rule have a surprisingly high tolerance for arrogance in others. But if you want non-economists to stick with you, you might want to inject some notes of humility into what you write.
One simple way to let people get to know you without seeming arrogant is to highlight a range of other people you think highly of. The set of people you think highly of is very revealing of who you are. (Of course, the set of people you criticize and attack is also very revealing of who you are, but not in the same way.)
Jonah Berger’s book Contagious is one of the few books in my life where I got to the end and then immediately and eagerly went back to the beginning to read it all over again for the second time. (I can’t remember another one.) Of course, it is a relatively short book. But still, it took a combination of great stories, interesting research results, and practical value for me as a blogger to motivate me to read it twice in quick succession. I recommend it. And I would be interested in your thoughts about how to get a better chance of having blog posts and tweets go viral.
Jonah recommends two other books that with insights into what makes an idea successful:

Here is the full text of my 23d Quartz column, “QE or Not QE: Even Economists need lessons in quantitative easing, Bernanke style,” now brought home to supplysideliberal.com. It was first published on May 14, 2013. Links to all my other columns can be found here.
If you want to mirror the content of this post on another site, that is possible for a limited time if you read the legal notice at this link and include both a link to the original Quartz column and the following copyright notice:
© May 14, 2013: Miles Kimball, as first published on Quartz. Used by permission according to a temporary nonexclusive license expiring June 30, 2014. All rights reserved.
Martin Feldstein is an eminent economist. In addition to being a prolific researcher, he served as head of US president Ronald Reagan’s Council of Economic Advisors, and made the National Bureau of Economic Research (NBER) what it is today—an institution that Paul Krugman called “the old-boy network of economics made flesh.” (I am one of the many economists who belongs to the NBER.) But Feldstein was wrong when he wrote in the Wall Street Journal last week, “The time has come for the Fed to recognize that it cannot stimulate growth,” in an op-ed headlined “The Federal Reserve’s Policy Dead End: Quantitative easing hasn’t led to faster growth. A better recovery depends on the White House and Congress.”
“Quantitative easing” or “QE” is when a central bank buys long-term or risky assets instead of purchasing short-term safe assets. One possible spark for Feldstein’s tirade against quantitative easing was the Fed’s announcement on May 1 that it “is prepared to increase or reduce the pace of its purchases” of long-term government bonds and mortgage-backed securities depending on the economic situation. This contrasts with the Fed’s announcement on March 20 that had only pledged as if the Fed would either keep the rate of purchases the same or scale them back, depending on circumstances. Philadelphia Fed Chief Charles Plosser described this as the Fed trying “to remind everybody” that it “has a dial that can move either way.”
So the Fed sounds more ready to turn to QE when needed than it did before.
Feldstein’s argument boils down to saying, “The Fed has done a lot of QE, but we are still hurting, economically. Therefore, QE has failed.” But here he misunderstands the way QE works. The special nature of QE means that the headline dollar figures for quantitative easing overstate how big a hammer any given program of QE is. Once one adjusts for the optical illusion that the headline dollar figures create for QE, there is no reason to think QE has a different effect than one should have expected. To explain why, let me lay out again the logic of one of the very first posts on my blog, “Trillions and Trillions: Getting Used to Balance Sheet Monetary Policy.” In that post I responded to Stephen Williamson, who misunderstood QE (or “balance sheet monetary policy,” as I call it there) in a way similar to Martin Feldstein.
To understand QE, it helps to focus on interest rates rather than quantities of assets purchased. Regular monetary policy operates by lowering safe short-term interest rates, and so pulling down the whole structure of interest rates: short-term, long-term, safe and risky. The trouble is that there is one safe interest rate that can’t be pulled down without a substantial reform to our monetary system: the zero interest rate on paper currency. (See “E-Money: How Paper Currency is Holding the US Recovery Back.”) There is no problem pulling other short-term safe interest rates (say on overnight loans between banks or on 3-month Treasury bills) down to that level of zero, but trying to lower other short-term safe rates below zero would just cause people to keep piles of paper currency to take advantage of the current government guarantee that you can get a zero interest rate on paper currency, which is higher than a negative interest rate.
As long as the zero interest rate on paper currency is left in place by the way we handle paper currency, the Fed’s inability to lower safe, short-term interest rates much below zero means that beyond a certain point it can’t use regular monetary policy to stimulate the economy any more. Once the Fed has hit the “zero lower bound,” it has to get more creative. What quantitative easing does is to compress—that is, squish down—the degree to which long-term and risky interest rates are higher than safe, short-term interest rates. The degree to which one interest rate is above another is called a “spread.” So what quantitative easing does is to squish down spreads. Since all interest rates matter for economic activity, if safe short-term interest rates stay at about zero, while long-term and risky interest rates get pushed down closer to zero, it will stimulate the economy. When firms and households borrow, the markets treat their debt as risky. And firms and households often want to borrow long term. So reducing risky and long-term interest rates makes it less expensive to borrow to buy equipment, hire coders to write software, build a factory, or build a house.
Some of the confusion around quantitative easing comes from the fact that in the kind of economic models that come most naturally to economists, in which everyone in sight is making perfect, deeply-insightful decisions given their situation, and financial traders can easily borrow as much as they want to, quantitative easing would have no effect. In those “frictionless” models, financial traders would just do the opposite of whatever the Fed does with quantitative easing, and cancel out all the effects. But it is important to understand that in these frictionless models where quantitative easing gets cancelled out, it has no important effects. Because in the frictionless models quantitative easing gets canceled out, it doesn’t stimulate the economy. But because in the frictionless models quantitative easing gets cancelled out it has no important effects. In the world where quantitative easing does nothing, it also has no side effects and no dangers. Any possible dangers of quantitative easing only occur in a world where quantitative easing actually works to stimulate the economy!
Now it should not surprise anyone that the world we live in does have frictions. People in financial markets do not always make perfect, deeply-insightful decisions: they often do nothing when they should have done something, and something when they should have done nothing. And financial traders cannot always borrow as much as they want, for as long as they want, to execute their bets against the Fed, as Berkeley professor and prominent economics blogger Brad DeLong explains entertainingly and effectively in “Moby Ben, or, the Washington Super-Whale: Hedge Fundies, the Federal Reserve, and Bernanke-Hatred.” But there is an important message in the way quantitative easing gets canceled out in frictionless economic models. Even in the real world, large doses of quantitative easing are needed to get the job done, since real-world financial traders do manage to counteract some of the effects of quantitative easing as they go about their normal business of trying to make good returns. And “large doses” means Fed purchases of long-term government bonds and mortgage-backed bonds that run into trillions and trillions of dollars. (As I discuss in “Why the US Needs Its Own Sovereign Wealth Fund,” quantitative easing would be more powerful if it involved buying corporate stocks and bonds instead of only long-term government bonds and mortgage-backed bonds.) It would have been a good idea for the Fed to do two or three times as much quantitative easing as it did early on in the recession, though there are currently enough signs of economic revival that it is unclear how much bigger the appropriate dosage is now.
Does QE work? Most academic and central bank analyses argue that it does. (See for example, work by Arvind Krishnamurthy and Annette Vising-Jorgenson of Northwestern University, and work by Signe Krogstrup, Samuel Reynard and Barbara Sutter of the Swiss National Bank. ) But I am also impressed by the decline in the yen since people began to believe that Japan would undertake an aggressive new round of QE. One yen is an aluminum coin that can float on the surface tension of water. Since September, it has floated down from being worth 1.25 cents (US) to less than a penny now. Exchange rates respond to interest rates, so the large fall in the yen is a strong hint that QE is working for Japan, as I predicted it would when I advocated massive QE for Japan back in June 2012.
Sometimes friction is a negative thing—something that engineers fight with grease and ball bearings. But if you are walking on ice across a frozen river, the little bit of friction still there between your boots and the ice allow you to get to the other side. It takes a lot of doing, but quantitative easing uses what friction there is in financial markets to help get us past our economic troubles. The folks at the Fed are not perfect, but they know how quantitative easing works better than Martin Feldstein does. If we had to depend on the White House and Congress for economic recovery, we would be in deep, deep trouble. It is a good thing we have the Fed.
UPDATE January 10, 2018: My presentation "Breaking Through the Zero Lower Bound" has evolved into a pair of presentations "21 Misconceptions about Eliminating the Zero Lower Bound (or Any Effective Lower Bound on Interest Rates)" and "Implementing Deep Negative Interest Rates: A Guide." The links are the latest versions of the presentations, as I gave them at Boston University on November 16, 2018.
Videos:
For more on this topic (including a 5-minute interview), see my bibliographical post “How and Why to Eliminate the Zero Lower Bound: A Reader’s Guide.”
Other than presentations at the University of Michigan, where I worked for 29 years, and the University of Colorado Boulder, where I am now, here is a list of places I have or am scheduled to give these presentations or closely related presentations:
Bank of England, May 20, 2013
Bank of Japan, June 18, 2013
Keio University, June 21, 2013
Japan’s Ministry of Finance, June 24, 2013
University of Copenhagen, September 5, 2013
National Bank of Denmark, September 6, 2013
Ecole Polytechnique (Paris), September 10, 2013
Paris School of Economics, September 12, 2013
Banque de France, September 13, 2013
Federal Reserve Board, November 1, 2013
US Treasury, May 19, 2014
European Central Bank, July 7, 2014
Bundesbank, July 8, 2014
Bank of Italy, July 11, 2014
Swiss National Bank, July 15, 2014
Society for the Advancement of Economic Theory Conference in Tokyo, August 20, 2014
Princeton University, October 13, 2014
Federal Reserve Bank of New York, October 15, 2014
New York University, October 17, 2014
European University Institute (Florence), October 29, 2014
Qatar Central Bank and Texas A&M University at Qatar joint seminar, November 17, 2014
International Monetary Fund, May 4, 2015
London conference on “Removing the Zero Lower Bound on Interest Rates” sponsored by the Imperial College Business School, the Brevan Howard Centre for Financial Analysis, the Centre for Economic Policy Research (CEPR) and the Swiss National Bank, panel on Economics, Financial, Legal and Practical Issues, May 18, 2015
Bank of England: Keynote Address for “Chief Economists’ Workshop– The Future of Money,” May 19, 2015
Bank of Finland, May 20, 2015
Sveriges Riksbank, May 21, 2015
Uppsala University, May 25, 2015
Norges Bank, May 28, 2015
Bank of Canada, June 11, 2015
Reserve Bank of New Zealand, July 22, 2015
New Zealand Treasury, August 5, 2015
Lake Forest University, September 1, 2015
Federal Reserve Bank of Chicago, September 3, 2015
American Economic Association Meetings, San Francisco, January 4, 2016
IMF, European Section, June 3, 2016
Brookings Institution, Hutchins Center Conference, June 6, 2016
St. Louis Fed Conference, September 23, 2016
Bank of Japan, September 27, 2016
Bank of Thailand, September 29, 2016
Bank Indonesia, October 3, 2016
Chulalongkorn University, Bangkok, October 5, 2016
Bank of Korea, October 6, 2016
Bank of Japan, October 7, 2016
Minneapolis Fed Conference, October 18-19, 2016
Sveriges Riksbank (Stockholm), October 31-November 1, 2016
Austrian National Bank November 2-4, 2016
Bank of Israel, November 6-7, 2016
Brussels Conference on “What is the impact of negative interest rates on Europe’s financial system? How do we get back?” sponsored by the European Capital Markets and Institute (ECMI), the Centre for European Policy Studies (CEPS) and the Brevan Howard Centre for Financial Analysis, November 9, 2016
Czech National Bank, November 10-11, 2016
European Central Bank, November 14-16, 2016
Bank of International Settlements, November 17, 2016
Swiss National Bank, November 18, 2016
Kansas City Fed, December 20, 2016
Bank of Canada/Central Bank Research Association Conference, July 20, 2017
Denver Association of Business Economists, August 16, 2017
De Nederlandsche Bank (Amsterdam), September 28, 2017
Bruegel Conference (Brussels), October 2, 2017
Bank of Spain, October 3-5, 2017
Bank of Portugal, October 9-10, 2017
Harvard University, November 12-13, 2018
Brown University, November 14, 2018
MIT, November 15, 2018
Boston University, November 16, 2018
Bundesbank, October 28, 2020 (virtual)
Reserve Bank of Australia, November 16, 2020 (virtual)
Shandong University, April 15 and September 22, 2024 (virtual)
(If you want to know more about the personal side of these trips, see my post “Electronic Money: The Travelogue.”)
Below is what I had to say in two early entries in this post that went beyond simply giving the itinerary of my worldwide, multi-year “Breaking Through the Zero Lower Bound” tour:
June 17, 2013: I went to the Bank of England to talk about how to eliminate the zero lower bound back in May. Tomorrow I will give this presentation (download) at the Bank of Japan:
I think my online readers will also find it interesting. It includes arguments that I have not made online yet in any detail.
The associated paper is very preliminary (in particular, it has very long quotations about the history of thought that need to be cut down to size, and needs to be revised along the lines of the Powerpoint file), but here is the current draft of the paper “Breaking Through the Zero Lower Bound” (download).
Update, June 29, 2013: My electronic money presentations on June 18 at the Bank of Japan, June 21 at Keio University and June 24 at Japan’s Ministry of Finance were well-received. The fact of my seminar makes the part of the International Herald Tribune’s summary of Leika Kihara’s (gated) article “Japan policy appears set, like it or not” that I have italicized false:
The central bank is said to have no new stimulus plan in the works, nor is it pondering alternative measures.
Though I argue in my presentation that an electronic yen policy is superior to the massive quantitative easing that I advocated for Japan on June 29, 2012, because an electronic yen allows monetary policy to steer the economy without inflation, some version of an electronic yen is also the plausible fall-back policy if massive quantitative easing does not work.
For the record, the type of quantitative easing I advocated for Japan involved massive purchases of corporate stocks and bonds–“assets chosen to have nominal interest rates as far as possible above zero.” Purchases of corporate stocks and bonds should be much more powerful than purchases of Japanese government bonds. Though the Bank of Japan has the legal authority to purchases corporate stocks and bonds, there is a concern (perhaps misplaced) about the possible consequences of the risk for the Bank of Japan’s net worth. An alternative would be for Japan to push further in increasing the risky asset holdings in the Government Pension Investment Fund. That would be in line with what I write in my column “Why the US Needs Its Own Sovereign Wealth Fund.”

My father, Edward Lawrence Kimball, is 82 years old to my 52. To honor him on this father’s day, I wanted to give you an example of his wry sense of humor. (I warned him a while back that this was coming, so he won’t be totally surprised.)
In her February 2, 2012 post “Move Over Harvard: BYU Law Has Got Memorial Trash Cans,” in the online magazine Above the Law, Staci Zaretsky reports receiving an email saying:
While other law schools memorialize their noteworthy alumni with their name on a moot court room or on a co-curricular competition, BYU has stooped to a new low and now memorializes its alumni on trash cans.
Staci then continues:
The trash can isn’t dedicated to an alumnus, but rather, a professor emeritus of the law school. Professor Edward L. Kimball, who retired in 1995, used to teach criminal law, and was one of the original members of the BYU Law faculty. Here’s how the law school has chosen to honor Professor Kimball… [See the illustration above.]
The plaque on the Little Garbage Pail That Could reads: “The Edward L. Kimball Memorial Trash Can.” How freaking insulting. Professor Kimball is 82 years old, and according to his list of publications, he seems to be the master of all things Mormon. And all you’re going to give him is a trash can?
It took until the next day for Staci to figure out what was going on. She got this response from Brigham Young University’s J. Reuben Clark Law School:
Professor Kimball was noted for two things: First, he had a dry sense of humor; and second, he did not take himself too seriously.
When he and his wife, Bee, gave a generous gift to the law school, the development officer indicated that there would be a plaque honoring them on the wall near the Moot Court Room. Professor Kimball objected and indicated that he would prefer to have a large, gold trash can placed in the foyer of the law school with a very small plaque stating: The Edward L. Kimball Memorial Trash Can.
Professor and Mrs. Kimball hoped that the “trash can” would bring a smile to students or visitors who read the plaque.“
I stirred up more of a storm than I expected by praising some of Umair’s words. It turned into a very interesting discussion that came around to the positive again at the end.

Miles Kimball: A big issue that the Bank of England is worried about is that the UK may not be far below the natural level of output at all. They’re very interest in the productivity puzzle and I’m hoping they’ll put out a prize for research into it one of these days.
Tomas Hirst: We’ve had some interesting discussions on Pieria about how we can explain the productivity puzzle – including how it might reflect miscalculations of output and growing problems in the UK labour market.
Jonathan Portes: Do they really think that we’re not far below the natural level of output at the moment?
Miles Kimball: Well opinions differ. I think it’s safe to say there’s a very active debate on exactly that question.
Tomas Hirst: The minutes of the MPC’s most recent meeting suggest that there’s something of a schism opening up in the committee between those worrying about the risks of further QE purchases (who are currently in the majority) and those worrying about the continued weakness of output. Do you think it reflects this debate?
Miles Kimball: Pieria really ought to talk about this more. For many other economies it seems crystal clear to almost everybody with an ounce of sense that output is below the natural level but I don’t know if it’s true in the UK. It’s not even clear to me, I just don’t know.
The broadest sphere of the debate should really be trying to get a hold of that productivity puzzle. In addition to measures that could add to aggregate demand for the UK I think a great deal of work needs to be done to assess whether it really is below the natural level of output or not.
Tomas Hirst: I think in the UK people have been too focused on headline figures of inflation and unemployment, for example. What people have missed is the fact that core inflation has been below target throughout the crisis, which might itself justify further stimulus.
Miles Kimball: Well remember that the new remit from the Treasury says that the MPC should look through government-administered prices.
Tomas Hirst: Yes, but could that change in mandate not be a response to this problem of growing doubts in the usefulness of headline figures?
Miles Kimball: What I’m saying is that the remit could suggest that the BoE is being asked to look more at core inflation. It’s actually a little bit of a mixed message as they’re being told that their target should remain linked to headline inflation but are being told to look through the headline numbers at what’s happening to core inflation. Pushing them towards core inflation is important.
On the productivity puzzle, there are things that can be solved by expansion and things that can’t. In the recession the government is not as willing to let firms go bankrupt so you get a long tail of unproductive firms carrying on. If you convince everybody that you’ve got all the aggregate demand you want you can allow for more bankruptcies, which will mean some of the puzzle will automatically correct.
Frances Coppola: I’ve heard that argument a lot but I’m not 100% convinced. You’ve got to look through the recession to see what the long-term secular trend is.
Over the last few years we’ve seen a huge increase in self-employment and at the same time self-employed incomes have crashed. That can’t be to do simply with unproductive companies.
Jonathan Portes: It’s an aggregate demand problem.
Frances Coppola: Exactly!
Jonathan Portes: Actually it was part of David Blanchflower’s recent paper that discussed a growing number of people in the UK who want to work more hours and can’t get them. If you’re self-employed and you want to work more hours the only thing that is stopping you is a lack of demand.
Frances Coppola: Speaking from personal experience, as I am self-employed and have been for a long time in a business that requires specialist skills, things were fine until two years ago. Since then demand has collapsed. And it’s not just singing. I’ve never seen the situation out there this bad.
Part 1: Pieria debate on electronic money and negative interest rates
How Can We Explain Britain’s Productivity Puzzle? – Pieria
Perverse incentives and productivity – Coppola Comment
Can Intangible Investment Explain The UK Productivity Puzzle – Professor Jonathan Haskel
Keep up to date with the latest thinking on some of the day’s biggest issues and get instant access to our members-only features, such as the News Dashboard, Reading List,Bookshelf & Newsletter. It’s completely free.

A Joint Post by Miles Kimball and Yichuan Wang
Yichuan (see photo above) and I talked through the analysis and ideas for this post together, but the words and the particulars of the graphs are all his. I find what he has done here very impressive. On his blog, where this post first appeared on June 4, 2013, the last two graphs are dynamic and show more information when you hover over what you are interested in. This post is a good complement to our analysis in our second joint Quartz column: “Autopsy: Economists looked even closer at Reinhart and Rogoff’s data–and the results might surprise you,” which pushes a little further along the lines we laid out in “For Sussing Out Whether Debt Affects Future Growth, the Key is Carefully Taking Into Account Past Growth.”
In a recent Quartz column, we found that high levels of debt do not appear to affect future rates of growth. In the Reinhart and Rogoff (henceforth RR) data set on debt and growth for a group of 20 advanced economies in the post WW-II period, high levels of debt to GDP did not predict lower levels of growth 5 to 10 years in the future. Notably, after controlling for various intervals of past growth, we found that there was a mild positive correlation between debt to GDP and future GDP growth.
In a companion post, we address some of the time window issues with some plots how adjusting for past growth can reverse any observed negative correlation between debt and future growth. In this post, we want to address the possibility that future growth can lead to high debt, and explain our use of instrumental variables to control for this possibility.
One major possibility for this relationship is that policy makers are forward looking, and base their decisions on whether to have high or low debt based on their expectations of future events. For example, if policy makers know that a recession is coming, they may increase deficit spending to mitigate the upcoming negative shock to growth. Even though debt may have increased growth, this would have been observed as lower growth following high debt.On the other hand, perhaps expectations of high future growth make policy makers believe that the government can afford to increase debt right now. Even if debt had a negative effect on growth, the data would show a rapid rise in GDP growth following the increase in debt.
Apart from government tax and spending decisions informed by forecasts of future growth, there are other mechanical relationships between debt and growth that are not what one should be looking for when asking whether debt has a negative effect on growth. For example a war can increase debt, but the ramp of the war makes growth high then and predictably lower after the ramp up is done and predictably lower still when the war winds down. So there is an increase in debt coupled with predictions for GDP growth different from non-war situations. None of this has to do with debt itself causing a different growth rate, so we would like to abstract from it.
To do so, we need to extract the part of the debt to GDP statistic that is based on whether the country runs a long term high debt policy, and to ignore the high debt that arises because of changes in expected future outcomes or because of relatively mechanical short-run aggregate demand effects of government purchases as a component of GDP. Econometrically, this approach is called instrumental variables, and would involve using a set of variables, called instruments, that are uncorrelated with future outcomes to predict current debt.
Since we are considering future outcomes, a natural choice for instrument would be the lagged value of the debt to GDP ratio. As can be seen below, debt to GDP does not jump around very much. If debt is high today, it likely will also be high tomorrow. Thus lagged debt can predict future debt. Also, since economic growth is notoriously difficult to forecast, the lagged debt variable should no longer reflect expectations about future economic growth.
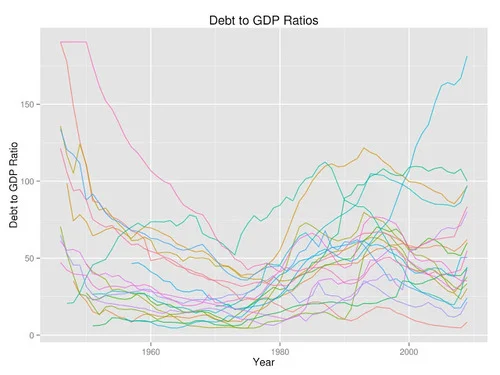
By using lagged debt and growth as instruments, we isolate the part of current debt that reflects debt from a long term high debt policy, and not by short run forecasts or other mechanical pressures. We plot the resulting slopes on debt to GDP in the charts below, for both future growth in years 0-5 and for future years 5-10. For the raw data and computations, consult the public dropbox folder.
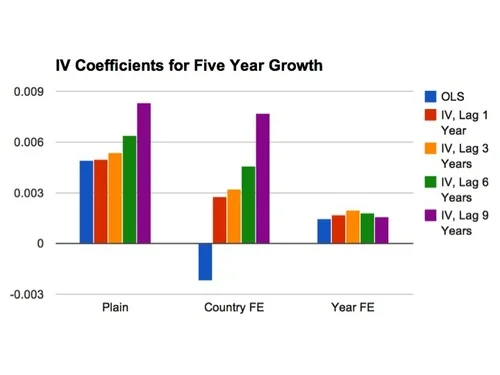
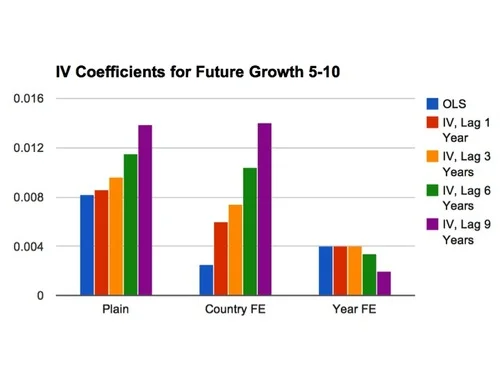
From these graphs, we can make some observations.
First, almost all the coefficients, across all the different lags and fixed effects, are positive. Since these results are small, we should not put too much weight on statistical significance. However, it should be noted that the plain results, OLS and IV, for both growth periods are all statistically significant at at least the 95% confidence level, and the IV estimates for the 5-10 year period in particular are significant at the 99% confidence level.
The one negative estimate, OLS estimate with country fixed effects, has a standard error with absolute size twice as large as the actual slope estimate.Moreover, country fixed effects are difficult to interpret because they pivot the analysis from looking at high debt versus low debt countries towards analyzing a country’s indebtedness relative to its long run average.
These results are striking considering therobustness with which Reinhart and Rogoff present the argument thatdebt causes low growth in their 2012 JEP article. Yet instead of finding a weaker negative correlation, after controlling for past growth, we find that the estimated relationship between current debt and future growth is weakly positive instead.
Second, when taking out year fixed effects, there is almost no effect of debt and future . Econometrically, year fixed effects takes out the average debt level in every year, which leaves us analyzing whether being more heavily indebted relative to a country’s peers in that year has an additional effect on growth. Because this component is consistently smaller than the regular IV coefficient, this suggests,for the advanced countries in the sample, it’s absolute, not relative, debt that matters.
This should be no surprise. As most recently articulated in RR’s open letter to Paul Krugman, much of the argument against high debt levels relies on a fear that a heavily indebted country becomes “suddenly unable to borrow from international capital markets because its public and/or private debts that are a contingent public liability are deemed unsustainable.” The credit crunch stifles growth and governments are forced to engage in self-destructive cutbacks just in order to pay the bills. At its core, this is a story about whether the government can pay back the liabilities. But whether or not liabilities are sustainable should depend on the absolute size of the liabilities, not just whether the liabilities are large relative to their peers.
Now,our conclusion is not without limitations. As Paul Andrew notes, the RR data set used focuses on “20 or so of the most healthy economies the world has ever seen,” thus potentially adding a high level of selection bias.
Additionally, we have restricted ourselves to the RR data set of advanced countries in the post WW-II period. The 2012 Reinhart and Rogoff paper considered episodes of debt overhangs from the 1800’s, and thus the results are likely very different. However, it is likely that prewar government policies, such the gold standard and the lack of independent monetary authorities, contributed to the pain of debt crises. Thus our timescale does not detract from the implication that debt has a limited effect on future growth in modern advanced economies.
In their New York Times response to Herndon et. al., Reinhart and Rogoff “reiterate that the frontier question for research is the issue of causality”. And at this frontier, our Quartz column, Dube’s work on varying regression time frames, and these companion posts all suggest that causality from debt to growth is much smaller than previously thought.

Here is a link to my 25th column on Quartz, written with Yichuan Wang: “Autopsy: Economists looked even closer at Reinhart and Rogoff’s data–and the results might surprise you.”
Yichuan recently finished his first year as an undergraduate at the University of Michigan. His blog is Synthenomics. You can find Yichuan on Twitter here.
In this article in the Independent, David Blanchflower compares the task facing former head of the Bank of Canada Mark Carney as head of the Bank of England to the task facing former University of Michigan Provost Phil Hanlon as head of Dartmouth. For the Record, from what I saw, I thought Phil Hanlon did a great job at the University of Michigan as Budget Associate Dean of the College of Literature Science and Arts, as Budget Associate Provost of the university, and finally as Provost. The University of Michigan weathered tough financial times well, which was only possible because our leaders were good at distinguishing fat from muscle.
I realized recently that Willem Buiter had written a second post on negative nominal interest rates. This link is part of my series on the history of thought for negative nominal interest rates and electronic money. Other posts in this series are
And here is a link to my sub-blog on electronic money:
http://blog.supplysideliberal.com/tagged/emoney
(There is also a handy link at my sidebar.)

Logo for the TV series "Heroes,“ which engraved the phrase "save the world” into my brain.
This is the text for my June 9, 2013 Unitarian-Universalist sermon to the Community Unitarian-Universalists in Brighton, Michigan. You can see the video here.
This is the fourth Unitarian-Universalist sermon I have posted. The others are
This is the first sermon I have given that I have known in advance I would post. I wrote it with my online readers in mind as well as the Unitarian Universalists in Brighton.
Abstract: Many of us have a strong desire to do something big, both because we want to make the world a better place and because of ambition. That desire can get twisted in various ways, but it is also behind much of the progress in the world. How can we harness ambition for good, and link it to genuine visions of a better world?
Human beings are roiling puddles of emotions, not all of them pretty. For example, the Medieval Pope Gregory I listed seven deadly sins: wrath, greed, sloth, pride, lust, envy, and gluttony. And yet we roiling puddles of emotions sometimes set out to make the world a better place. How can entities so imperfect accomplish anything good? I want to argue that if we turn our emotions, even the ugly ones, into sources of energy for action—while putting careful guardrails on our actions to try to ensure that we do good rather than harm—then together we can save the world.
Economists like me think a lot about the fact that living standards and lifespans are dramatically higher than they were as recently as a century ago. And Steven Pinker argues that there is a lot less violence than in the past in his book “The Better Angels of Our Nature.” But it is clear the world still needs saving. Many live in poverty. Many live under oppressive dictatorships. There are a thousand reasons why and ways in which people are mistreated, sometimes even by their own families. The possibilities of a nuclear holocaust fostered by nuclear proliferation or catastrophic climate change fostered by the burning of coal and other fossil fuels cast monstrous shadows over the future. And in a very immediate way, the global economic slump in the last few years has shaken people’s faith in governments and economies.
A year ago, I started a blog, “Confessions of a Supply-Side Liberal,” out of a mixture of raw ambition, desire for self-expression, duty, and hope. Sometimes duty keeps me up late at night, but it is raw ambition that makes me wake up too early in the morning so that I slip further and further behind in my sleep. And sometimes, alongside that raw ambition, I find anger driving my writing, when I see someone who is relatively influential saying things that I think not just off-base, but potentially destructive. (See for example “Contra John Taylor" and ”Even Economists Need Lessons in Quantitative Easing, Bernanke Style.“) Whatever redeeming social value there is to what I write when in that state does not take away the fact that the experience is one of giving vent to anger.
The Christian tradition emphasizes the motivations someone has in doing any particular action. At one level, this makes a lot of sense. In the Sermon on the Mount, Jesus said:
But if thine eye be evil, thy whole body shall be full of darkness. If therefore the light that is in thee be darkness, how great is that darkness! (Matthew 6:22)
and
Beware of false prophets, which come to you in sheep’s clothing, but inwardly they are ravening wolves. Ye shall know them by their fruits. Do men gather grapes of thorns, or figs of thistles? Even so every good tree bringeth forth good fruit; but a corrupt tree bringeth forth evil fruit. A good tree cannot bring forth evil fruit, neither can a corrupt tree bring forth good fruit. (Matthew, 7:15-18)
If someone’s overall objective is evil or self-serving, the only way what they do will have a good effect on the world is if all their attempts to get their way by harming others are forestalled by careful social engineering. It is exactly such social engineering to prevent people from stealing, deceiving, or threatening violence that yields the good results from free markets that Adam Smith talks about in The Wealth of Nations—the book that got modern economics off the ground. And even then, social pressure to favor those in the old boys’ club can deprive others of the full benefits of the free market.
But what if there is a bumper-car derby in one’s heart between an overall desire to do good and uglier emotions such as wrath, greed, sloth, pride, lust, envy, and gluttony? Are all one’s efforts polluted?
The simple answer to this question is that when motives are impure, the danger of a bad result is great, but that careful checks and balances can sometimes yield a good result from imperfect soil. One of the best examples is Martin Luther King. He committed serial adultery and plagiarized an important piece of his Ph.D. dissertation in a way that makes no sense unless he was subject to lust, greed, sloth, pride and envy. But for the Civil Rights Movement, the main danger was from unchecked anger, and the principle of nonviolence that Martin Luther King championed set up a key guardrail for the effects of anger that was crucial to the degree of racial reconciliation that he and his coworkers wrought in the world.
On the other side of the question, suppose one’s motives are pure as the driven snow. Is a good result inevitable?
St. Bernard of Clairvaux gave the answer when he said “The road to hell is paved with good intentions,” or in another loose translation: “Hell is full of good meanings, but heaven is full of good works.” There are at least two gaps between good intentions and good works. One is inaction; the other is lack of the knowledge and wisdom to take a good objective and turn it into good policy. The law of unintended consequences is particularly powerful in economics. It is not easy understanding complex social systems. And doing the wrong thing for the right reason reliably yields the wrong result. At least in economics, the history of thought and the things we have tried in the past have given us some hard-won expertise. The law of unintended consequences may operate even more powerfully in some other area of social change, but where our understanding of cause and effect is even less than our understanding of economics, we have little choice but to try what seems best and see what happens, hoping to learn from our mistakes.
How to go about saving the world: Let’s say that despite all the difficulties, you want to save the world. That is, you want to make things better and make a difference. How should you proceed?
A. Find a vision: First you need to decide what your goal is. What is your vision of how the world should be? How does the world fall short? What kinds of outcomes would make you feel the world was getting closer to that vision? A few years back, I argued that Unitarian Universalists should make sharing our individual visions of what a wonderful world would look like a regular part of our religious practice, just as Unitarian Universalists have made sharing our individual beliefs—our credos—a regular part of our religious practice.
One bit of training I found very useful in finding and expressing a vision was Landmark Education’s personal growth and leadership courses. These courses are a bit of applied philosophy with an Existentialist twist, but touch on both religious and psychological issues. They go back to Werner Erhard’s est, but are the kinder, gentler version. They take place typically in a large group setting of maybe 150 people. With a group of that size, it is easy for the leader of the class to get volunteers to set out problems from their lives that they would like to solve. I found these courses very powerful and helpful, and recommended them to many of my friends and family at the time I was doing them. I recommend them to this day even though I have not personally done any courses since the mid-90’s. Most of my friends and family also had a good experience, though a few were turned off by hard-sell and the forcefulness of some of those running the courses. One of the most impressive outcomes from the Landmark course is the frequency with which people are able to let go of longstanding grudges and forgive others in their lives as a result of the courses.
Let me give a brief summary of what I learned. In the first course, the nature of our daily lives is dissected into the grudges, the self-pity and the serviceable but overused strategies that cover over our underlying insecurity. The Existential twist is that while all of this is meaningless, it is OK that it is meaningless, since that gives each of us the opportunity to choose what we want our lives to mean—our individual visions of a good life and a wonderful world. The later courses talk about how to articulate that vision, how to work backward from that vision to see what needs to be done now, and how to express that vision to others and involve them in helping to make it a reality.
In the Landmark courses, an ingenious screening mechanism along the lines of Kant’s categorical imperative is used to ensure that a vision is not too self-serving. Kant wrote:
Act only according to that maxim whereby you can, at the same time, will that it should become a universal law.
In the Landmark courses, a typical stem for a vision or personal mission statement is
“I am the possibility of all people …”
The other bit of quality control is that the rest of the people in the class vote on whether they think the vision speaks to them as well, though of course it is likely to have a special personal resonance to the one declaring the vision. What I articulated in the end was this:
I am the possibility of
- all people being empowered by math and other tools of understanding;
- fun;
- adventure into the unknown;
- human connection and justice and welfare;
- profound relationship;
- all people being joined together in discovery and wonder.
A declaration like that is a good start on a vision.
B. Make sure you know what you are doing. Here, one of the big dangers is that there are many people who will want to mislead you about what will really make a difference in the world. Many companies try to increase sales by convincing people that buying their product will save the world. And many organizations try to increase membership by convincing people that joining and supporting their organization will save the world. In some cases, it may be that buying the product or joining and supporting the organization will in fact help to save the world, but it pays to be skeptical.
In addition to cases like this where a bit of cynicism can actually be protective, there are many cases where someone you have chosen as a guide, though quite sincere, doesn’t know what he or she is talking about. In practice, there is no good substitute for trying to figure things out for yourself enough so that you can begin to separate the wheat from the chaff. It takes a little bit of expertise of your own to distinguish the true experts from the posers. And even then, you have to combine the facts and understanding you get from them with your own vision. For example, the balance you want to strike between symbolism and substance might be different than the balance struck by the expert you trust.
C. Stay on track. But finding a vision and making sure you know what you are doing are only the beginning. You need to set up guardrails so that your personal temptations and failings don’t distort or destroy the good you hope to do. Sloth could easily stop you in your tracks. Greed could lead you to sell out. Pride and envy could make you see someone who could be your biggest ally as if they were your biggest enemy. Lust, unchecked, can derail almost anyone’s efforts, as it derailed a substantial portion of what Bill Clinton could have otherwise done as president. Wrath can easily steer you wrong. And gluttony can lead to an early death that cuts everything short.
Avoiding the seven deadly sins isn’t enough. Here are some other principled guardrails.
1. The Basics: First, follow basic rules such as trying to give everyone a fair hearing, keeping your promises, giving credit where credit is due, and avoiding gratuitous nastiness.
I say “avoiding gratuitous nastiness” because I can understand why people sometimes feel that getting the job done requires sharp words, satire of opponents, or vigorous attacks. Fareed Zakaria, in a CNN interview with Paul Krugman about his spat with Carmen Reinhart and Ken Rogoff about their claim that government debt leads to lower economic growth, asked Paul this:
Fareed Zakaria: Are you surprised how personal this has gotten?
Paul Krugman: No, the stakes are high. I guess from my point of view, they went pretty far out on a limb with work which is far weaker than everything else in their careers. And, unfortunately, that became what they’re known for. And then if you said, well, this is really bad work and this had a deleterious effect on policy, which I believe to be the truth, how can it not be personal?
Let me say it, by the way – who cares, right? I mean who cares about my feelings or Carmen Reinhart’s feelings or Ken Rogoff’s feelings? We’re having a global economic crisis which is not over, which we have handled abysmally. We have massive long-term unemployment in the United States. We have massive youth unemployment in Southern Europe.
I don’t think the question of how civil a bunch of comfortable academic economists who went to MIT in the mid-1970s…I don’t think that matters at all compared to the question of the substantive issues and are we doing this wrong, which I think we are.
Quite apart from the substance of Paul’s debate with Carmen and Ken, I have to agree with Paul that when issues are important enough there can be a danger of being too nice to get down to brass tacks. However, being harsh also frays the social fabric in important ways. So it is a difficult judgment call.
2. The Truth. Second, don’t ever abandon the truth, even if it doesn’t seem to suit your purpose. There are two levels to honoring the truth:
One reason to honor the truth is that, in the end, it is hard to be genuinely effective at fooling others except by fooling yourself. And fooling yourself is one of the easiest ways to cloud your vision of a better world.
3. Equality. Third, treat everyone as an equal. Treat ordinary people with dignity and they will become extraordinary. Treat the high and mighty as human, and they won’t be able to hypnotize you by the trappings of power with which they surround themselves.
4. Perspective. Fourth, keep perspective. Among all the tasks that need to be accomplished to get the world a bit closer to your vision, some are more important than others. But it is easy to forget what is most important to the overall goal as the realities of overcoming obstacles narrows focus to one particular task at hand. Usually, the only way to keep perspective is keep returning to the original vision you identified as your goal, and again think through how each task fits into that larger goal.
5. Balance. Finally, in trying to save the world, don’t forget the rest of your life. In his first letter to Timothy (1 Timothy 5:18), the Apostle Paul quotes the Torah saying “Do not muzzle an ox while it is treading out the grain” and “the worker deserves his wages.” If you are trying to save the world you deserve to have enough of a life besides that to recharge and replenish yourself. And you have duties to those close to you—your family and friends—as well as to those far away. And should you forget the other parts of your life, that neglect will take a toll on the grand cause you have set for yourself, whether by lack of sleep, lack of serendipitous input into your thinking, or the distractions that come from troubled personal relationships. It is far better to bring others around to your vision, or get them started in finding their own, than to burn yourself out trying to save the world on your own.
As one would expect from a principle of balance, the demands of balance are not absolute. Sometimes sacrifices are necessary. But don’t be too quick to assume that the part of your overarching effort that is at hand is so important as to be worth sacrificing the parts of your overarching effort that are yet to come, that you haven’t yet even imagined. For most who set out to save the world, setting a pace that can last a lifetime and keeping to it will yield more fruit than going out in one blaze of glory. And time may bring yet greater wisdom.
Summary. To sum up, if you want to save the world, find a vision, make sure you know what you are doing, and stay on track by
One more thing that can make saving the world a rewarding experience–instead of a dreary one–is to be cheerful. The efforts of our ancestors to save the world have succeeded to a remarkable degree, giving us a much better world to live in than they had. There is no reason to doubt that our best efforts, too, will succeed in making the world our children and grandchildren live in better still.
Note: I have collected links to some of my "save-the-world” posts in “The Overton Window” and “Within the Overton Window.”

Miles Kimball, Jonathan Portes, Frances Coppola and Tomas Hirst gathered for lunch in London and May 22, 2013 to discuss the case for electronic money and negative interest rates. This post appeared first on Pieria on May 23, 2013.
Miles Kimball: I summarised the core of my presentation to the Bank of England in my post earlier this week – “A Minimalist Implementation of Electronic Money”. A lot of economic discussion in recent years has been about the zero lower bound so it’s important to start there.
I was trying to think about how you achieve electronic money legally as I think it sounds a little less radical if you look at it from that perspective. In general the public don’t understand the zero lower bound but negative rates on savings seem too crazy. So the real issue politically is going to negative nominal interest rates in the first instance but once you’re there eliminating the zero lower bound is not such a big step.
Cash storage is the issue but you’ve got three parts to that – taking electronic money out of cashpoints as paper money, storing it and putting it back into accounts. You don’t want to attack it at the withdrawal stage as then you’re blocking people from spending it, which is what you’re trying to avoid. Moreover, the storage stage is difficult to attack as we know that people are already hoarding lots of paper currency. So the number one thing you need for electronic money is for the central bank to have a deposit charge that varies over time.
Conceptually, you just set the interest rate on paper currency. That then determines what the exchange rate with electronic money is in a very simple way. Imagine say £1 earning that interest rate over a given period of time, then on any particular date I can work out its value. You could just set the interest rate on paper currency to be equal to the bank rate.
Jonathan Portes: Suppose you wanted an interest rate of -5%. If I’ve got £1000 in my bank account now what’s going to happen to it?
Miles Kimball: Under that scenario that’s going to turn in £950 in a year if you leave it in your bank account. Now I want to make sure that if you take it out of your bank account and put it back in at a later date it turns into the same £950.
So you say if you put paper pounds into your account a year from now you face a 5% deposit charge. The Bank of England only has to do that on reserves that it holds, but the banks would transmit that to everybody else.
Frances Coppola: They might not.
Miles Kimball: That’s why you have to allow people to refuse payment in paper currency at par, which is the key legal issue. Firms, individuals, creditors and government agencies have to be allowed to refuse payment at par.
Jonathan Portes: So let me get this straight, I know if I leave my £1000 in my account the bank is offering me an interest rate of -5% so I decide to take £1000 out. Now say I return it a year later, how does the bank know how much to charge?
Miles Kimball: They don’t need to. The Bank of England is announcing on any day what the exchange rate is so all the banks need to do is look at whatever the exchange rate is on that day.
As long as you have one central bank and two currencies the idea is totally credible. Nobody doubts that a pound is worth one hundred pence and that’s because the same central bank can issue both currencies. The same principle applies to electronic money and paper money.
Tomas Hirst: So if you take a £10 note to a shop to buy ten pounds worth of goods, how is a shopkeeper supposed to refuse to accept the payment?
Miles Kimball: It’s going to take you months and months before the deposit charge is even 3%. Right now shops are paying something like 1.5% in credit card company fees so at the moment shops hope people pay in cash but under this proposal they might prefer people to pay on credit card. If shops can absorb the 1.5% they can probably absorb 3% before having to push up prices.
People might even be able to get cash at a discount from the banks for a period of time. However, I do worry a little bit about spreads opening up if banks decide not to pass on negative rates to people.
From a legal point of view if you abolish legal tender, it’s just a central bank deposit charge – although you would need to insure that vault cash counted in reserve requirements was discounted in the same way.
Frances Coppola: I’m convinced that the mechanism can work, but it’s the effects that worry me. The key question is whether we are talking about negative deposit rates, negative lending rates or both. There have already been some experiments with negative deposit rates but not lending rates.
When you’ve got a negative deposit rate you might get some very untoward things start happening such as yield curve inversion. It could also mean the end of shadow banking as it would force money market funds to “break the buck”.
What actually happened when they attempted it in Denmark is that banks hid it from their customers by raising rates to borrowers. They absorbed the charge and didn’t pass the negative rates to customers. That’s absolutely not the impact you want.
Miles Kimball: They wouldn’t have done that if rates had been dropped to say -3% as they couldn’t have afforded to.
Frances Coppola: Yes, they could. And that’s what worries me. There’s no particular reason why banks would want to pass negative rates onto customers knowing that it could cause them simply to leave.
Miles Kimball: If domestic banks are doing that and running down their capital you could just raise capital requirements to prevent it from happening.
Frances Coppola: But you’re assuming that banks want to lend. In the UK we have a very badly damaged banking system, which as far as I can see doesn’t want to lend.
Miles Kimball: There’s got to be some rate low enough that would compel them to lend. You have to make sure there’s no place to hide other than putting money to work in the real economy.
Jonathan Portes: What stops companies from just moving all their money abroad?
Miles Kimball: The great thing about electronic money is that if any major country does it, it would force other countries to follow. You get a massive carry trade and capital outflows so if the UK does it you would get a massive export boost.
Hopefully others would then follow and you would get a massive worldwide monetary expansion.
Tomas Hirst: Doesn’t that assume that there is no structural impairment to the export sector and it can respond quickly to currency falls?
Miles Kimball: People in the UK may want to send pounds abroad but remember those pounds are still earning an interest rate of -5%, say, so folks abroad aren’t going to want to hold onto them either.
So if you don’t get others to follow, you can invite them to do a currency intervention and buy government debt at -5% and in effect you get a huge subsidy.
How to Set the Exchange Rate Between Paper Currency and Electronic Money – Confessions of a Supply-Side Liberal
The strange world of negative interest rates – Coppola Comment
Lingering Doubts over Negative Rates – Pieria
Doubting Tomas: Electronic Money in an Open Economy with Wounded Banks – Storify
Keep up to date with the latest thinking on some of the day’s biggest issues and get instant access to our members-only features, such as the News Dashboard, Reading List, Bookshelf & Newsletter. It’s completely free.

A recent picture of Miles
I was pleased that Brian Milner of the Globe and Mail found his way to my blog post “After Crunching Reinhart and Rogoff’s Data, We Found No Evidence That High Debt Slows Growth,” and in his article and in “Rogoff-Reinhart put cart before the horse” quotes my sentence:
What I find remarkable is that despite the likely negative effect of debt on growth from refinancing difficulties, we found no overall negative effect of debt on growth.
But Brian was inaccurate when he followed that quotation with the attribution
…Mr. Kimball wrote in a blog post at Quartz.
Brian didn’t realize that supplysideliberal.com is an independent blog.
Though I love my editors at Quartz, I have fiercely guarded the principle of the independence of supplysideliberal.com itself. As I said in my anniversary post
“A Year in the Life of a Supply-Side Liberal,”
it means a lot to me that I can say here anything that I think needs to be said on my own account without asking anyone’s permission.

Link to the article on the Johnson Business School website at Cornell
Ori Heffetz is now my coauthor many times over. There is a bio of him at the link. Here is his guest post on some of our joint work on the economics of happiness. Ori asks
Should governments monitor citizens’ happiness and use that data to inform policy? Many say yes; the question is how.
Most of our students at Johnson may be too young to remember, but in 1988, for the first time in history, an a cappella song made it to the #1 spot on the Billboard Hot 100 chart. Many of our alumni however won’t forget the huge success of Bobby McFerrin’s “Don’t Worry, Be Happy.” The artist’s unparalleled singing abilities aside, the song became an instant hit much thanks to its simple message that immediately resonated with everybody. After all, nobody wants to worry, and everybody wants to be happy.
But if everybody wants to be happy, shouldn’t governments be constantly monitoring the public’s level of happiness, assessing how different policies affect it, and perhaps even explicitly designing policies to improve national happiness (and reduce national worry)? Wouldn’t it make sense to add official happiness measures to the battery of indicators governments already closely track and tie policy to — such as GDP, the rate of unemployment, and the rate of inflation?
Researchers increasingly think so. Some advocate conducting nation-wide “happiness” surveys (or “subjective well-being” (SWB) surveys, to use the academic term), and using the responses to construct indicators that would be tracked alongside GDP-like measures. Although these proposals are controversial among economists, policymakers have begun to embrace them. In the past two years alone, for example, the U.S. National Academy of Sciences’ Committee on National Statistics convened a series of meetings of a “Panel on Measuring Subjective Well-Being in a Policy-Relevant Framework”; the OECD, as part of its Better Life Initiative, has been holding conferences on “Measuring Well-Being for Development and Policy Making”; and the U.K. Office of National Statistics began including the following SWB questions in its Integrated Household Survey, a survey that reaches 200,000 Britons annually:
Overall, how satisfied are you with your life nowadays?
Overall, how happy did you feel yesterday?
Overall, how anxious did you feel yesterday?
Overall, to what extent do you feel the things you do in your life are worthwhile?
These and other efforts follow the French government’s creation, in 2008, of the now-famous Stiglitz Commission — officially, the “Commission on the Measurement of Economic Performance and Social Progress”— whose members included a few Nobel laureates, and whose 2009 report recommends the collection and publication of SWB data by national statistical agencies. No wonder Gross National Happiness, a concept conceived in Bhutan in the 1970’s, is back in the headlines. Can a few simple questions on a national survey, such as the British (Fab) Four above, be the basis of a reliable indicator of national wellbeing? Will the Bank of England soon tie its monetary policy to the “rate of happiness” (or to the “rate of anxiety”), making central banks that still tie their policies to traditional indicators such as the rate of unemployment seem outdated?
Not so fast. While demand for SWB indicators is clearly on the rise — witness Ben Bernanke’s discussion of “the economics of happiness” in several speeches in recent years — efforts to construct and apply survey-based well-being indicators are still in their infancy. Among the most urgent still-unresolved practical questions are: Which SWB questions should governments ask? And how should responses to different questions be weighted relative to each other? The four questions above, for example, ask about life satisfaction, happiness, anxiety, and life being worthwhile. But does the public consider these the only — or even the most — important dimensions of well-being? And even if it does, how would people feel about — and will they support — a government policy that increases, say, both happiness and anxiety at the same time?
These are the questions that my colleagues — Dan Benjamin and Nichole Szembrot here at Cornell, and Miles Kimball at the University of Michigan — and I address in our working paper, “Beyond Happiness and Satisfaction: Toward Well-Being Indices Based on Stated Preference” (2012). The idea behind our proposed method for answering the two questions — the “what to ask” question and the “how to weight different answers” question — is simple and democratic, and consists of two steps: first, gather a list, as long as you can, of potential SWB questions that governments could potentially include in their surveys; and second, let the public determine, through a special-purpose survey that we designed, the relative weights.
To demonstrate our method, we followed these two steps. We began by compiling a list of 136 aspects of well-being, based on key factors proposed as important components of well-being in major works in philosophy, psychology, and economics. While far from exhaustive, our list represents, as far as we know, the most comprehensive compilation effort to date. It includes SWB measures widely used by economists (e.g., happiness and life satisfaction) as well as other measures, including those related to goals and achievements, freedoms, engagement, morality, self-expression, relationships, and the well-being of others. In addition, for comparison purposes, we included “objective” measures that are commonly used as indicators of well-being (e.g., GDP, unemployment, inflation).
Next, we designed and conducted what economists call a stated preference (SP) survey to estimate the relative marginal utility of these 136 aspects of well-being. In plain English, what that means is that we asked a few thousands of survey respondents to state their preference between aspects from our list (e.g., if you had to choose, would you prefer slightly more love in your life or slightly more sense of control over your life?). With enough such questions, we could estimate the relative weight our respondents put on each of these aspects of life.
Among other things, we found that while commonly measured aspects of well-being such as happiness, life satisfaction, and health are indeed among those with the largest relative weight (or marginal utility), other aspects that are measured less commonly have relative marginal utilities that are at least as large. These include aspects related to family (well-being, happiness, and relationship quality); security (financial, physical, and with regard to life and the future in general); values (morality and meaning); and having options (freedom of choice, and resources). Using policy-choice questions in which respondents vote between two policies that differ in how they affect aspects of well-being for everyone in the nation — rather than state which of two options they prefer for themselves — we continued to find the patterns above and in addition found high marginal utilities for aspects related to political rights, morality of others, and compassion towards others, in particular the poor and others who struggle. We also explored differences across demographic-group and political-orientation subpopulations of our respondents.
But these findings themselves are perhaps less important. After all, our sample was not representative, and we had to make practical compromises in our data collection and analysis that governments would not have to make. The main contribution of our work, we believe, lies in outlining a new method, and in demonstrating its feasibility. Our method for evaluating SWB questions and for determining their relative weight in a well-being index can now be discussed, criticized, and, as a result, improved on. The familiar conventional indicators such as GDP, inflation, and unemployment did not start in the refined state we know them today: they have been continually fine-tuned over many decades. We hope that our work will contribute to a similar process regarding a SWB-based index.
Many practical obstacles still have to be overcome before standardized, systematic measurement and tracking of SWB for policymaking purposes becomes a reality. But if the endeavor is successful, then perhaps our children — who I doubt will have heard of Bobby McFerrin’s #1 hit - will at some point consider a DWBH index - “Don’t Worry Be Happy” index - as standard as GDP and other indicators.
Note: I (Miles) give my take on the same research in my column “Judging the Nations: Wealth and Happiness are Not Enough.”
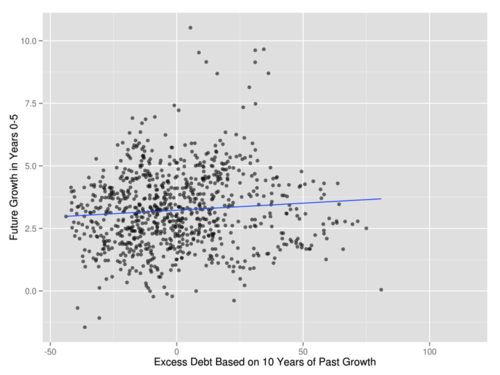
We are very pleased with the response to our May 29, 2013 Quartz column, “After crunching Reinhart and Rogoff’s data, we concluded that high debt does not slow growth.” Miles gives links to some of the online reactions in his (more accurately titled) companion blog post the next day, “After Crunching Reinhart and Rogoff’s Data, We Found No Evidence That High Debt Slows Growth.” The one reaction that called for another full post was Arindrajit Dube’s post “Dube on Growth, Debt and Past Versus Future Windows.” Arindrajit suggests in that post that in his working paper “A Note on Debt, Growth and Causality,” he had actually explored the variations that the two of us focus on, but we want to argue here that we did one important thing that Arindrajit did not try in his working paper: controlling for ten years worth of data on past growth, as we did in our Quartz column. In this post, we argue that controlling for ten years worth of data on past growth is the key to getting positive slopes for the partial correlation between debt and future growth. We were surprised to find that controlling for ten years of past GDP growth makes the partial correlation between debt and near future growth in future years 0 to 5positive(as well as the further future growth in future years 5 to 10).The graph at the top shows our main message. Since this is a long post, let us give the bottom line here and return to it below:
The two of us could not find even a shred of evidence in the Reinhart and Rogoff data for a negative effect of government debt on growth for either growth either in the short run (the next five years) or in the long run (as indicated by growth from five to ten years later).
The most important proviso in this statement is the clause “in the Reinhart and Rogoff data."
Yichuan has placed our programs in a public dropbox folder. Also, on Yichuan’s blog Synthenomics, we have an additional companion post, "Instrumental Tools for Debt and Growth,” showing that instrumenting the debt to GDP ratio by the past debt to GDP ratio in order to isolate high debt and low debt policies from high or low debt caused by recent events makes the relationship between debt and future growth more positive. (This is mainly due to evidence from movements of debt in tandem across countries over time rather than movements in debt that distinguish one country from another at a give time.)
Why it matters: Why does it matter whether the seeming effect of debt on future growth is a small positive number or a small negative number? Let us illustrate. Brad DeLong says (and Paul Krugman quotes Brad DeLong saying):
…an increase in debt from 50% of a year’s GDP to 150% is associated with a reduction in growth rates of 0.1%/year over the subsequent five years…
The first thing to say about this is that some of the estimates for going from 0 debt to a 50% debt to GDP ratio are bigger negative numbers. As Miles wrote in the companion post “After crunching Reinhart and Rogoff’s Data, We Found No Evidence That High Debt Slows Growth”:

…if I were convinced Arin Dube’s left graph were causal, the left graph seems to suggest that higher debt causes low growth in a very important way, though of course not in as big a way as slow growth causes higher debt. If it were causal, the left graph suggests it is the first 30% on the debt to GDP ratio that has the biggest effect on growth, not any 90% threshold.
The second thing to say is that reducing the growth rate .1% per year adds up. After five years, GDP would be .5% lower. Since the extra debt going from 50% to 150% is a year’s GDP, that is like a .5% per year addition to the interest on that extra debt, except that people throughout the economy experience the cost rather than the government alone. And if the effect on the path of GDP is permanent, that annual cost might not go away even when the debt is later repaid.
So we think it matters whether the best evidence points to what looks like a small positive slope or what looks like a small negative slope. And given how important the issues are, the Bayesian updating from results that are statistically insignificant at conventional levels of significance can have substantial practical importance.
There is a wide range of growth rates in the data. Even within a given country, growth rates can be very different over the many decades of time represented in the Reinhart and Rogoff data. So it should not be surprising that it is helpful to use data on many years of past growth in order to predict past growth. Define time t as the year in which the debt/GDP ratio is measured. Then what we focus on is the difference between predicting future real GDP growth based on only the growth rates from t-5 to t-4, t-4 to t-3, t-3 to t-2, t-2 to t-1, and t-1 to t, and adding to those five most recent past annual growth rates the average growth rate from t-10 to t-5. The graph immediately below shows that there is, indeed, variation in the growth rate from t-10 to t-5 that can’t be predicted by the most recent past five annual growth rates of GDP.

The next graph shows that the average growth rate from t-10 to t-5 does, indeed, help in predicting the future growth rate of GDP from t to t+5:
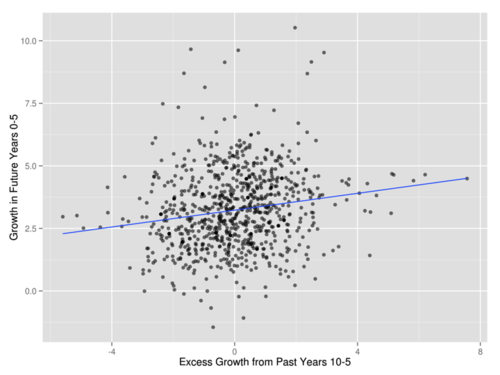
Here, “Excess Growth from Past Years 10-5” just means growth in past years 10 to 5 beyond what one could have guessed from knowing the most recent past five annual growth rates. In the multiple regression of future growth from t to t+5 on past growth, the t-statistic on “deep past” growth from t-10 to t-5 is 3.75, and so meets a very high standard of statistical significance.
One way to think of why growth from t-10 to t-5 might help in predicting future growth is that it might help indicate the pace of growth to which growth will tend to mean revert after short-run dynamics play themselves out. But one would expect that there is a limit to the extent to which more and more growth data from the past will help. We find that growth from t-10 to t-5 does not help much in predicting growth in the five-year period fifteen years later from t+5 to t+10, as can be seen in the following graph:

To illustrate the importance of carefully taking into account the predictive value of many past years of growth for future growth, let us show first what we would have gotten if we had only controlled for the most recent five annual growth rates of GDP.

Here we get a small downward slope. But we don’t believe this small downward slope is causal, since it doesn’t adequately control for all the things other than debt that make both past and future growth tend to be higher or that make both past and future growth tend to be low, and as a byproduct, also have an effect on debt.
Looking at further future growth in future years 5 to 10, we see a positive relationship between excess debt and further future GDP growth.
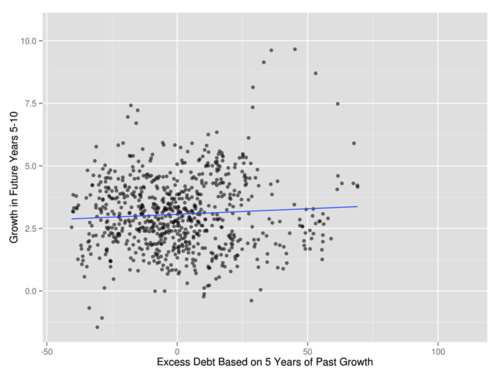
THE MAIN EVENT: THE RELATIONSHIP BETWEEN DEBT AND FUTURE GROWTH AFTER CONTROLLING FOR TEN YEARS OF PAST GROWTH.
Someone might object that after controlling for a full ten years of past GDP growth (the most recent five years of annual growth, plus the average growth rate in past years 10 to 5), there wouldn’t be much independent variation in debt left with which to identify the effects of debt, but that is not so. The following graph shows that some country-years have higher debt than would be predicted by ten years of past growth and some have lower debt than would be predicted by ten years of past growth.

We call the difference between actual debt and what could have been predicted by ten years of past growth is “excess debt.” (It is important to understand that this is only of interest as a statistical object.) As can be seen in the graph immediately below (identical to the graph at the top of the post), debt above what could have been predicted by ten years of past growth has a positive relationship to future growth in the five years after the year when the debt to GDP ratio is measured.

Looking further into the future, to average GDP growth in future years 5 to 10, the relationship between excess debt and further growth looks more strongly positive.

Year Fixed Effects: How much of the evidence is from movements in average debt across all countries over time and how much is from movements of debt in one country relative to another?
In our Quartz column “After crunching Reinhart and Rogoff’s data, we concluded that high debt does not slow growth,” we mentioned, but did not show, what happens when time fixed effects are included in order to isolate what part of the evidence depends on distinct movements in different countries as opposed to movement of debt in many different countries in tandem over time. Surprisingly, with the specification here, even with year fixed effects, we find a positive partial correlation between debt and future growth, for both GDP growth in future years 0 to 5 and GDP growth in future years 5 to 10. (See the two graphs immediately below.) These positive slopes are smaller, however, reflecting the subtraction of the evidence from movements of debt in many different countries in tandem over time.


The bottom line is that the only time we ever found a negative partial correlation between debt and future growth–that is, the only time we found a relationship between excess debt and future growth that would result in a negative coefficient in a multiple regression–was when we only controlled for five years of growth when looking at debt and near future growth in future years 0 to 5. When we control for a full ten years of past growth, we get a positive relationship between debt and future growth in both future growth windows and both with and without year fixed effects.
In our Quartz column “After crunching Reinhart and Rogoff’s data, we concluded that high debt does not slow growth,“ we wrote
…the two of us could not find even a shred of evidence in the Reinhart and Rogoff data for a negative effect of government debt on growth.
There, we meant, we could not find even a shred of evidence in the Reinhart and Rogoff data for a negative effect of government debt on growth in the long run, as indicated by GDP growth from five to ten years later. Now let us amplify our statement to say, as we did at the top:
The two of us could not find even a shred of evidence in the Reinhart and Rogoff data for a negative effect of government debt on growth for either growth either in the short run (the next five years) or in the long run (as indicated by growth from five to ten years later).
The most important proviso in this statement is the clause "in the Reinhart and Rogoff data."
A key limitation of our analysis: the Reinhart-Rogoff data set may undersample troubled countries.
In his post “None the Wiser After Reinhart, Rogoff, et al.,” Paul Andrews argues:
What has not been highlighted though is that the Reinhart and Rogoff correlation as it stands now is potentially massively understated. Why? Due to selection bias, and the lack of a proper treatment of the nastiest effects of high debt: debt defaults and currency crises.
The Reinhart and Rogoff correlation is potentially artificially low due to selection bias. The core of their study focuses on 20 or so of the most healthy economies the world has ever seen. A random sampling of all economies would produce a more realistic correlation. Even this would entail a significant selection bias as there is likely to be a high correlation between countries who default on their debt and countries who fail to keep proper statistics.
Furthermore Reinhart and Rogoff’s study does not contain adjustments for debt defaults or currency crises. Any examples of debt defaults just show in the data as reductions in debt. So, if a country ran up massive debt, could’t pay it back, and defaulted, no problem! Debt goes to a lower figure, the ruinous effects of the run-up in debt is ignored. Any low growth ensuing from the default doesn’t look like it was caused by debt, because the debt no longer exists!
In the light of Paul Andrews’s critique, we want to make it clear that our analysis is about the claim we felt Carmen Reinhart and Ken Rogoff seem to have been making that there might well be a negative effect of debt on growth even for countries that no doubts will repay their debts. That is, the question we are trying to answer is whether there is a negative effect of debt on growth other than the obvious effect that national bankruptcy or fears of national bankruptcy have.

Here is the full text of my 22d Quartz column, “An Economist’s Mea Culpa: I Relied on Reinhart and Rogoff," now brought home to supplysideliberal.com. The comments I made when I first flagged this column on my blog now seem outdated. You would be better advised to read my post "After Crunching Reinhart and Rogoff’s Data, We Found No Evidence that High Debt Slows Growth” and the Quartz column I wrote with Yichuan Wang that it links to. Yichuan and I plan another follow-up post to that very soon. Note that the argument below about debt raising interest rates for countries that do not have their own currency still stands, and has been amplified by Paul Andrews here, though the other worries I mention based on the Reinhart and Rogoff data set have been allayed.
I hope you notice the allusions to incentives and mechanism design below. In terms of what Carmen Reinhart and Ken Rogoff should have done that they didn’t do, “Be very careful to double-check for mistakes” is obvious. But on consideration, I also felt dismayed that they didn’t do a bit more analysis on their data early on to make a rudimentary attempt to answer the question of causality. I wouldn’t have said it quite as strongly as Matthew Yglesias, but the sentiment is basically the same.
If you want to mirror the content of this post on another site, that is possible for a limited time if you read the legal notice at this link and include both a link to the original Quartz column and the following copyright notice:
© April 20, 2013: Miles Kimball, as first published on Quartz. Used by permission according to a temporary nonexclusive license expiring June 30, 2014. All rights reserved.
Ken Rogoff is an economist who has always been kind to me, and for whom I have deep respect. And I have no animus toward Carmen Reinhart. Nevertheless, I hope there has been a nightmarish quality to the last few days of what Quartz writer Matt Phillips called a “bone-crunching social media pile-on that Harvard economists Ken Rogoff and Carmen Reinhart received in recent days after some other researchers questioned their influential findings that high government debt is a drag on economic growth.” I say this because I know from my own experience as a researcher how powerfully the hint of such an embarrassment motivates economists and other researchers to sweat the details to get things right. Some errors will always slip through the cracks, but a researcher ought to live in mortal fear of a contretemps like that Reinhart and Rogoff have found themselves in this week.
Reinhart and Rogoff have not only caused embarrassment for themselves, but also for all those who have in any way relied on their results. Those who made their case by overinterpreting the particular results that have now been discredited should be the most embarrassed. Quartz’s Tim Fernholz gives a rundown of politicians and other policy makers who relied heavily on Reinhart and Rogoff’s results in “How influential was the Reinhart and Rogoff study warning that high debt kills growth?”
But I, like many others, have relied on Reinhart and Rogoff’s results in smaller ways—and wish this embarrassment on myself as a warning for the future. No one is perfect, but it is important not to undercut the motivation to be careful by softening the penalty for error too much. I am lucky I can heal the damage; I have fully updated the argument I made based on Reinhart and Rogoff’s results in my column “What Paul Krugman got wrong about Italy’s economy” in a way that I think leaves the force of the overall argument in that column intact. Here in full, is the new passage, which also gives my view of the substantive issue that Reinhart and Rogoff have now occasioned so much confusion about:
And despite the recent revelation of errors in Carmen Reinhart and Ken Rogoff’s famous study of debt levels and economic growth, which I discuss here and which motivated the update you are reading (the original passage can be found here), there are reasons to think that high levels of debt are worth worrying about.
First, for a country like Italy that does not have its own currency (since it shares the euro with many other countries), Paul Krugman’s own graph shows a correlation between national debt as a percentage of GDP and the interest rate that a country pays.
Second, the paper by Thomas Herndon, Michael Ash and Robert Pollin that criticizes Reinhart and Rogoff finds that, on average, growth rates do decline with debt levels. Divide debt levels into medium high (60% to 90% of GDP), high (90% to 120% of GDP), and very high (above 120% of GDP). Then the growth rates are 3.2% with medium-high debt, 2.4% with high debt, and 1.4% with very high debt. (I got these numbers by combining the 4.2% growth rate for countries in the 0 to 30% debt-to-GDP ratio range from Table 3 with the estimates in Table 4 for how things are different at higher debt levels.) Moreover, contrary to the impression one would get from the column here, Herndon, Ash and Pollin’s Table 4 indicates that the differences between low levels of debt and high levels of debt are not just due to chance, though what Herndon, Ash and Pollin emphasize is that very low levels of debt, below 30% of GDP, have a strong association with higher growth rates. Overall, with the data we have, we don’t know what causes what, so there is no definitive answer to how much we should worry about debt, but ample reason not to treat debt as if it were a nothing. [For a more recent reassessment of that evidence, see my post “After Crunching Reinhart and Rogoff’s Data, We Found No Evidence that High Debt Slows Growth” and the Quartz column I wrote with Yichuan Wang that it links to.]
There is definitely a reasonable case to be made that if additional spending or tax cuts are the only way to stimulate the economy, then we should do it even at the cost of additional debt. But as I argue both in “What Paul Krugman got wrong about Italy’s economy” and in “Why austerity budgets won’t save your economy,” there are ways to stimulate the economy without adding to its debt burden, and stimulating the economy in a way that doesn’t add substantially to the national debt is better than stimulating the economy in a way that does.
Unlike what many politicians would do in similar circumstances, Reinhart and Rogoff have been forthright in admitting their errors. (See Chris Cook’s Financial Times post, “Reinhart and Rogoff Recrunch the Numbers.”) They also used their response to put forward their best argument that correcting the errors does not change their bottom line. Given the number of bloggers arguing the opposite case—that Reinhart and Rogoff’s bottom line has been destroyed—it is actually helpful for them to make their case in what has become an adversarial situation, despite their self-justifying motivation for doing so. And though I see a self-justifying motivation, I find it credible that Reinhart and Rogoff’s original error did not arise from political motivations, since as they note in their response, of their two major claims—(1) debt hurts growth and (2) economic slumps typically last a long time after a financial crisis—the claim that debt hurts growth is congenial to Republicans, while the claim that it is normal for slumps to last a long time after a financial crisis is congenial to Democrats. But it hurt the nation’s decision-making process when the true statement, that we should be worried high levels of national debt might have a negative effect on growth, was mangled into the idea that a debt-to-GDP ratio of 90% is a critical threshold for the effects of debt on the economy—an idea that gained the traction it did because of Reinhart and Rogoff’s mistake.

