For Sussing Out Whether Debt Affects Future Growth, the Key is Carefully Taking into Account Past Growth
A Joint Post by Miles Kimball and Yichuan Wang
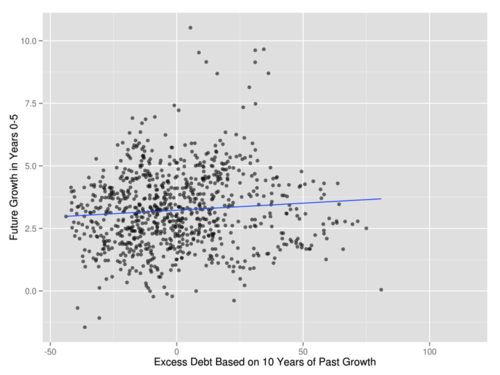
We are very pleased with the response to our May 29, 2013 Quartz column, “After crunching Reinhart and Rogoff’s data, we concluded that high debt does not slow growth.” Miles gives links to some of the online reactions in his (more accurately titled) companion blog post the next day, “After Crunching Reinhart and Rogoff’s Data, We Found No Evidence That High Debt Slows Growth.” The one reaction that called for another full post was Arindrajit Dube’s post “Dube on Growth, Debt and Past Versus Future Windows.” Arindrajit suggests in that post that in his working paper “A Note on Debt, Growth and Causality,” he had actually explored the variations that the two of us focus on, but we want to argue here that we did one important thing that Arindrajit did not try in his working paper: controlling for ten years worth of data on past growth, as we did in our Quartz column. In this post, we argue that controlling for ten years worth of data on past growth is the key to getting positive slopes for the partial correlation between debt and future growth. We were surprised to find that controlling for ten years of past GDP growth makes the partial correlation between debt and near future growth in future years 0 to 5positive(as well as the further future growth in future years 5 to 10).The graph at the top shows our main message. Since this is a long post, let us give the bottom line here and return to it below:
The two of us could not find even a shred of evidence in the Reinhart and Rogoff data for a negative effect of government debt on growth for either growth either in the short run (the next five years) or in the long run (as indicated by growth from five to ten years later).
The most important proviso in this statement is the clause “in the Reinhart and Rogoff data."
Yichuan has placed our programs in a public dropbox folder. Also, on Yichuan’s blog Synthenomics, we have an additional companion post, "Instrumental Tools for Debt and Growth,” showing that instrumenting the debt to GDP ratio by the past debt to GDP ratio in order to isolate high debt and low debt policies from high or low debt caused by recent events makes the relationship between debt and future growth more positive. (This is mainly due to evidence from movements of debt in tandem across countries over time rather than movements in debt that distinguish one country from another at a give time.)
Why it matters: Why does it matter whether the seeming effect of debt on future growth is a small positive number or a small negative number? Let us illustrate. Brad DeLong says (and Paul Krugman quotes Brad DeLong saying):
…an increase in debt from 50% of a year’s GDP to 150% is associated with a reduction in growth rates of 0.1%/year over the subsequent five years…
The first thing to say about this is that some of the estimates for going from 0 debt to a 50% debt to GDP ratio are bigger negative numbers. As Miles wrote in the companion post “After crunching Reinhart and Rogoff’s Data, We Found No Evidence That High Debt Slows Growth”:

…if I were convinced Arin Dube’s left graph were causal, the left graph seems to suggest that higher debt causes low growth in a very important way, though of course not in as big a way as slow growth causes higher debt. If it were causal, the left graph suggests it is the first 30% on the debt to GDP ratio that has the biggest effect on growth, not any 90% threshold.
The second thing to say is that reducing the growth rate .1% per year adds up. After five years, GDP would be .5% lower. Since the extra debt going from 50% to 150% is a year’s GDP, that is like a .5% per year addition to the interest on that extra debt, except that people throughout the economy experience the cost rather than the government alone. And if the effect on the path of GDP is permanent, that annual cost might not go away even when the debt is later repaid.
So we think it matters whether the best evidence points to what looks like a small positive slope or what looks like a small negative slope. And given how important the issues are, the Bayesian updating from results that are statistically insignificant at conventional levels of significance can have substantial practical importance.
Ten years worth of past GDP growth data are significantly better at predicting future GDP growth than five years worth of past GDP growth data.
There is a wide range of growth rates in the data. Even within a given country, growth rates can be very different over the many decades of time represented in the Reinhart and Rogoff data. So it should not be surprising that it is helpful to use data on many years of past growth in order to predict past growth. Define time t as the year in which the debt/GDP ratio is measured. Then what we focus on is the difference between predicting future real GDP growth based on only the growth rates from t-5 to t-4, t-4 to t-3, t-3 to t-2, t-2 to t-1, and t-1 to t, and adding to those five most recent past annual growth rates the average growth rate from t-10 to t-5. The graph immediately below shows that there is, indeed, variation in the growth rate from t-10 to t-5 that can’t be predicted by the most recent past five annual growth rates of GDP.

The next graph shows that the average growth rate from t-10 to t-5 does, indeed, help in predicting the future growth rate of GDP from t to t+5:
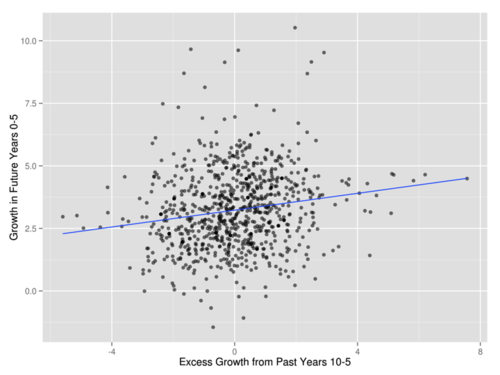
Here, “Excess Growth from Past Years 10-5” just means growth in past years 10 to 5 beyond what one could have guessed from knowing the most recent past five annual growth rates. In the multiple regression of future growth from t to t+5 on past growth, the t-statistic on “deep past” growth from t-10 to t-5 is 3.75, and so meets a very high standard of statistical significance.
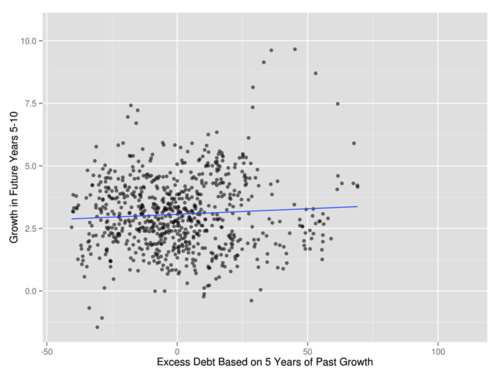
One way to think of why growth from t-10 to t-5 might help in predicting future growth is that it might help indicate the pace of growth to which growth will tend to mean revert after short-run dynamics play themselves out. But one would expect that there is a limit to the extent to which more and more growth data from the past will help. We find that growth from t-10 to t-5 does not help much in predicting growth in the five-year period fifteen years later from t+5 to t+10, as can be seen in the following graph:

What would we have found if we had neglected to control for growth in past years 10 to 5?
To illustrate the importance of carefully taking into account the predictive value of many past years of growth for future growth, let us show first what we would have gotten if we had only controlled for the most recent five annual growth rates of GDP.

Here we get a small downward slope. But we don’t believe this small downward slope is causal, since it doesn’t adequately control for all the things other than debt that make both past and future growth tend to be higher or that make both past and future growth tend to be low, and as a byproduct, also have an effect on debt.
Looking at further future growth in future years 5 to 10, we see a positive relationship between excess debt and further future GDP growth.
THE MAIN EVENT: THE RELATIONSHIP BETWEEN DEBT AND FUTURE GROWTH AFTER CONTROLLING FOR TEN YEARS OF PAST GROWTH.
Someone might object that after controlling for a full ten years of past GDP growth (the most recent five years of annual growth, plus the average growth rate in past years 10 to 5), there wouldn’t be much independent variation in debt left with which to identify the effects of debt, but that is not so. The following graph shows that some country-years have higher debt than would be predicted by ten years of past growth and some have lower debt than would be predicted by ten years of past growth.

We call the difference between actual debt and what could have been predicted by ten years of past growth is “excess debt.” (It is important to understand that this is only of interest as a statistical object.) As can be seen in the graph immediately below (identical to the graph at the top of the post), debt above what could have been predicted by ten years of past growth has a positive relationship to future growth in the five years after the year when the debt to GDP ratio is measured.

Looking further into the future, to average GDP growth in future years 5 to 10, the relationship between excess debt and further growth looks more strongly positive.

Year Fixed Effects: How much of the evidence is from movements in average debt across all countries over time and how much is from movements of debt in one country relative to another?
In our Quartz column “After crunching Reinhart and Rogoff’s data, we concluded that high debt does not slow growth,” we mentioned, but did not show, what happens when time fixed effects are included in order to isolate what part of the evidence depends on distinct movements in different countries as opposed to movement of debt in many different countries in tandem over time. Surprisingly, with the specification here, even with year fixed effects, we find a positive partial correlation between debt and future growth, for both GDP growth in future years 0 to 5 and GDP growth in future years 5 to 10. (See the two graphs immediately below.) These positive slopes are smaller, however, reflecting the subtraction of the evidence from movements of debt in many different countries in tandem over time.


The bottom line is that the only time we ever found a negative partial correlation between debt and future growth–that is, the only time we found a relationship between excess debt and future growth that would result in a negative coefficient in a multiple regression–was when we only controlled for five years of growth when looking at debt and near future growth in future years 0 to 5. When we control for a full ten years of past growth, we get a positive relationship between debt and future growth in both future growth windows and both with and without year fixed effects.
In our Quartz column “After crunching Reinhart and Rogoff’s data, we concluded that high debt does not slow growth,“ we wrote
…the two of us could not find even a shred of evidence in the Reinhart and Rogoff data for a negative effect of government debt on growth.
There, we meant, we could not find even a shred of evidence in the Reinhart and Rogoff data for a negative effect of government debt on growth in the long run, as indicated by GDP growth from five to ten years later. Now let us amplify our statement to say, as we did at the top:
The two of us could not find even a shred of evidence in the Reinhart and Rogoff data for a negative effect of government debt on growth for either growth either in the short run (the next five years) or in the long run (as indicated by growth from five to ten years later).
The most important proviso in this statement is the clause "in the Reinhart and Rogoff data."
A key limitation of our analysis: the Reinhart-Rogoff data set may undersample troubled countries.
In his post “None the Wiser After Reinhart, Rogoff, et al.,” Paul Andrews argues:
What has not been highlighted though is that the Reinhart and Rogoff correlation as it stands now is potentially massively understated. Why? Due to selection bias, and the lack of a proper treatment of the nastiest effects of high debt: debt defaults and currency crises.
The Reinhart and Rogoff correlation is potentially artificially low due to selection bias. The core of their study focuses on 20 or so of the most healthy economies the world has ever seen. A random sampling of all economies would produce a more realistic correlation. Even this would entail a significant selection bias as there is likely to be a high correlation between countries who default on their debt and countries who fail to keep proper statistics.
Furthermore Reinhart and Rogoff’s study does not contain adjustments for debt defaults or currency crises. Any examples of debt defaults just show in the data as reductions in debt. So, if a country ran up massive debt, could’t pay it back, and defaulted, no problem! Debt goes to a lower figure, the ruinous effects of the run-up in debt is ignored. Any low growth ensuing from the default doesn’t look like it was caused by debt, because the debt no longer exists!
In the light of Paul Andrews’s critique, we want to make it clear that our analysis is about the claim we felt Carmen Reinhart and Ken Rogoff seem to have been making that there might well be a negative effect of debt on growth even for countries that no doubts will repay their debts. That is, the question we are trying to answer is whether there is a negative effect of debt on growth other than the obvious effect that national bankruptcy or fears of national bankruptcy have.