Jessica Hammer: Venezuela's Deadly Struggle

Jessica Hammer is a student in my "Monetary and Financial Theory” class at the University of Michigan. Students in the class write three blog posts a week for an internal class blog. Of the ones they select as their own best work, I have been choosing a few to publish as guest posts on supplysideliberal.com. This is Jessica’s second appearance here. Her previous guest post is “Jessica Hammer: The World Poverty Situation is Better Than You Think.” This post about Venezuela is a grim but powerful complement to Ezequiel Tortorelli’s guest post, “The Trouble with Argentina.” Here is what Jessica has to say about Venezuela:


When someone hears about Venezuela, I suspect the first thing most people think of is oil. Of course, this is due to the fact that this country is an OPEC member and exports around 25 million barrels of oil to the United States each month. Venezuela has one of the most abundant oil sources in the world but, unfortunately, it is being wasted. Perhaps you remember ex-President Hugo Chavez, and his passing in recent years. Many hoped the tyrannical government would disappear along with him, but the power of “chavismo” (the support for Chavez’s socialist reforms) prevailed. But the current president (the used-to-be bus driver who received no college education and is bluntly incompetent) , Nicolas Maduro, is slowly losing control of the country – or so they hope. The world knows little about the horrid situation in Venezuela, and how this potentially-wealthy nation is destroying itself.

Caracas, the capital, is currently (and has been for a while) the world’s deadliest city. Not Baghdad or Mogadishu. Mexico is known for its drug-related violence, but its murder rate is well below Venezuela’s rate of 73 per 100,000 citizens. Caracas, however, experienced a soaring rate of more than 200 per 100,000 in 2012 (and 2013 was even higher). To put this into perspective, Venezuela’s murder rate is higher than the death rates of the US and the 27 countries of the EU combined. Violence is so predominant, that people live in constant fear of going outside. Most wealthy people have to travel with bodyguards in order to avoid kidnappers. I personally know a lot of Venezuelans, and they all know of someone who has been murdered – either friends, family, or friends of friends. Most cases like these are a result of robberies. But gun fights are common to establish property rights, personal disputes, or drug-related problems. And the problem isn’t only the fact that violence is so widespread; nearly 90% of murders go unpunished. The police are so corrupt that they are often the ones involved in murders.

As if this weren’t enough to put up with, Venezuelans face daily shortages of basic goods. The most common ones include toilet paper, flour, sugar, cooking oil, and chicken. Not only are there rations on available goods, but these goods are not readily available. Producers point to the price controls and the limitations on foreign currency, which limit the availability of resources needed for production. Also, there are viable claims that 30 billion dollars were robbed from Cadivi (the government body which administered currency exchange) by the government elite. This is seen as the cause for the country’s current shortage problems.

Additionally, inflation is among the highest in the world at 56%.  Maduro eliminated the Cadivi program last year, which Venezuelans used to transfer dollars overseas. Today, a dollar goes for 84.2 bolivares in the black market – 13 times more than the official rate. Toyota is halting production, while Ford is significantly reducing its production in Venezuela. Venezuela’s economy is in shambles.

And its government is worse. Without getting into too much detail, Venezuela’s government is best described as a raging civil war where the Chavistas in power have bought the support of enough people to think they can deceive the country into thinking that they are representing them. In the last elections, the result was announced before all the votes were counted. People took to social media to report the fraud. Pictures and videos of military men burning boxes of ballots quickly spread over Facebook and Twitter. But the government had enough power over the military to stay “enchufados” (plugged in), as the opposition says. However, beginning February 12th, Venezuelans have taken to the streets by the millions. They are peacefully protesting against the government that is driving their country into ruins. Sadly, many people have been killed as they continue to take to the streets in protest, and the government persistently uses military force to subdue them. Now, they are outraged that the government is so blunt in oppressing them – not even trying to hide it anymore.

It is tragic to see a country so rich in natural resources, with so much talent and potential, deprived of its capability to provide its people with a decent life-style. Corrupt governments have a far-reaching effect on the economic well-being of a country. Most people in the US, and many other democratic countries, don’t realize the deep extent of corruption that exists in places like Venezuela. My intent is to raise awareness about this. The Venezuelan government is not the only corrupt, undemocratic government in the world, but at the moment, it stands out as one that is close to being brought down in favor of a more open, honest government. More pressure from foreign governments is essential–along with the noble efforts of the Venezuelan people–to put Venezuela back on the path of freedom and democracy.

Will Econ Blogging Hurt Your Career?

I ran across this very interesting youtube video by Noah Smith on “Will Econ Blogging Hurt Your Career?” I wanted to address that question as well. On balance, going forward, I think blogging is likely to be more of a help to your career than a hindrance–at least if you enjoy blogging. 

One way in which my experience has been different from Noah’s is that I spend much more than an hour and a half per week blogging, if I include writing for Quartz. I have undertaken blogging as a serious career move, and so don’t mind spending some serious time at it. But that is something more appropriate for my career stage than it would be for a graduate student or untenured professor. And having grown children who are already off making their way in the world makes it easier. 

As far as my own career goes, I feel the blogging has only been a plus. My colleagues in the Economics Department at the University of Michigan have been very supportive. Part of the reason is that I am not the only blogger here at Michigan. Noah has a list of other bloggers connected with the University of Michigan here. (Folks at the University of Michigan are blog readers, too. Interesing statistic: Ann Arbor edges out New York City as the city generating the most visits to my blog.)

As always, there are tradeoffs. Blogging might take time away from writing economics journal articles. But in my case I have found that blogging is fun enough and rewarding enough that I willingly do it at the expense of many leisure activities. And blogging builds human capital–contacts, writing skill and ideas (generated in important measure at the expense of non-blogging leisure)–that are valuable for research activities. So even the sign of the effect on traditional research productivity is, at this point, unclear. (Also, blogging should have some positive effect on citation accounts just by the inevitable publicizing of one’s own research, and is very helpful for one’s teaching.) Blogging creates additional temptations when one is avoiding hard but necessary tasks. But most of us face plenty of temptations in that regard anyway, and have had to develop techniques of self-discipline sufficient to get our work done.

I have a story to tell. Chris House’s office is right next to mine, with our doors one foot apart from each other. A couple of months ago, I walked into his office to talk as I often do, and he asked me how much time blogging took. I said “It depends on why you are asking; if you are asking so you can scold me for all the time I spend blogging …” Then it turned out he wanted to ask me if I thought it would be worth his while to start blogging. (I should say here that Chris is not the sort of person who would scold in any case; he would tease.)

Along the lines of what I said in my talk “On the Future of the Economics Blogosphere,” I said that I thought blogging was bound to grow in importance within economics–and that there is a first-mover advantage: for any given quality, those who start blogging earlier will gain more prominence and reap more rewards, as long as they remain continuously active.

Chris was persuaded; here is a link to Chris’s excellent blog. Among many other things he has accomplished with his blog, Chris caused Paul Krugman to write the sentences I think are most worthy of anything Paul Krugman has ever said of being included in a collection of famous quotations.

Mary O'Keeffe on Slow-Cooked Math

Mary O'Keeffe was my Ec 10 teacher back in 1977-1978. She has appeared previously on supplysideliberal.com in “My Ec 10 Teacher Mary O’Keeffe Reviews My Blog” and “Another Reminiscence from My Ec 10 Teacher, Mary O’Keeffe.” She gave me permission to share this Facebook post she made in response to the post “Cathy O'Neill on Slow-Cooked Math”:  


I am also a slow-cook mathematician, for the most part. I find I have to get into a state of flow in order to really think math through. Often I find it takes me a while to really understand exactly what the problem is getting at—but after a while, it just sinks in and becomes blindingly crystal clear and beautiful. I am rather glad that I didn’t experience buzzer-style or any kind of timed math contests as a kid—they might have permanently discouraged me and induced me into giving up on doing anything mathematically related. I think one of the reasons my husband and I were such a good partnership (professionally) was that he was good at blazing fast insights and I was good at thinking things through more rigorously and deeply. (This is somewhat of a stereotype. We didn’t always fit neatly into these separate boxes, but it is a pretty good first approximation description.)

Jonathan Haidt—What the Tea Partiers Really Want: Karma

I am a fan of Jonathan Haidt’s work. I learned a lot from his book The Righteous Mind: Why Good People Are Divided by Politics and Religion, and used those ideas in my column “Judging the Nations: Wealth and Happiness Are Not Enough.” I also quoted one of my favorite passages from The Righteous Mind in "God and Devil in the Marketplace.“

Jonathan wrote a very interesting piece in the Wall Street, October 16, 2010: ”What the Tea Partiers Really Want.“ Here is a key passage:

But the passion of the tea-party movement is, in fact, a moral passion. It can be summarized in one word: not liberty, but karma.

The notion of karma comes with lots of new-age baggage, but it is an old and very conservative idea. It is the Sanskrit word for "deed” or “action,” and the law of karma says that for every action, there is an equal and morally commensurate reaction. Kindness, honesty and hard work will (eventually) bring good fortune; cruelty, deceit and laziness will (eventually) bring suffering. No divine intervention is required; it’s just a law of the universe, like gravity.

Karma is not an exclusively Hindu idea. It combines the universal human desire that moral accounts should be balanced with a belief that, somehow or other, they will be balanced. In 1932, the great developmental psychologist Jean Piaget found that by the age of 6, children begin to believe that bad things that happen to them are punishments for bad things they have done.

To understand the anger of the tea-party movement, just imagine how you would feel if you learned that government physicists were building a particle accelerator that might, as a side effect of its experiments, nullify the law of gravity. Everything around us would float away, and the Earth itself would break apart. Now, instead of that scenario, suppose you learned that politicians were devising policies that might, as a side effect of their enactment, nullify the law of karma. Bad deeds would no longer lead to bad outcomes, and the fragile moral order of our nation would break apart. For tea partiers, this scenario is not science fiction. It is the last 80 years of American history.

Zane Salem: How to Boost US Exports

I like my student Zane Salem’s post because it applies the principles I talk about in my post “International Finance: A Primer” and the related tools I talk about in my “Monetary and Financial Theory” class, particularly this “International Finance” Powerpoint file. The policy perspective is distinctively his. I am not signing on to all of it, but starting with sound theory makes what he says coherent in a way in a way most commentators who talk about trade are not.

Note that a Twitter thread disputes Zane’s claim of a positive correlation between net exports and GDP. I think when Zane said “GDP is directly correlated with the country’s net exports" he simply meant that net exports is a component of aggregate demand. But "directly correlated” has a different technical meaning. The overall correlation between net exports and GDP depends on many other causal forces in addition to the effect of net exports on GDP as a component of aggregate demand. 

Here is what Zane has to say:


Last December’s export data revealed the United State’s trade deficit sunk deeper than expected. This was caused by both an increase in its imports and decrease in its exports. Since GDP is directly correlated with the country’s net exports, the recovering US economy will keep taking dents if this is not turned around.

Background for Improving Exports

The current administration has worked at improving exports numbers since the recession. This was done by attempting to remove trade barriers with other countries and by offering financial assistance with ease of information. While the data suggests there have been some successes, numbers are not where they could be. A subsidy or tax break in any way, shape, or form doesn’t provide a suitable solution for this problem the short run.

That being said, I see two possible ways to improve a country’s exports:

  • Invest in assets abroad
  • Protect intellectual property abroad

A most effective way to increase exports is by having a relatively weak currency. This makes a country’s goods/services look relatively cheaper and thus a worthwhile purchase to others. By applying the basic principles of international finance we covered in lecture, I’ve devised an algorithm to create a relatively weaker currency and thus more attractive prices for being imported. This could be applied to the United States or any other country.

Investment in Foreign Assets

  1. Invest in foreign funds – (ideally assets with HIGH rates of return)
  2. In exchange for their intentional IOUs, they receive unintentional IOUs (US dollars)
  3. The bouncing around unintentional IOUS (US dollars) overseas leads to an increase in the purchasing of our exports (from their perspective our goods look cheaper and they have dollars to exchange)
  4. In addition to the return on the investment, NX increases for the US

The reason this works is because of the currency exchange that takes place after the initial investment. The unintentional US dollars that foreign countries incur will be used to purchase goods and services from the US, effectively making the investment an exchange of assets for goods and services. The shortcoming here is that this algorithm requires a simplified model. And, in addition to large number of unconsidered factors, this method is susceptible to high taxes/fees that foreign funds could charge foreign investors. Its implementation could potentially be a controversial political gesture as well.

But we have seen small examples of this. For instance, the Czech republic, staying clear of the Euro-zone, can be seen as doing something similar to this strategy to boost its exports. By investing abroad, they have been able to increase their exports. We have also seen examples with larger impacts, specially from China. China invests huge sums in US and Japanese funds, and in return the US and Japan imports a large number of Chinese goods.

In fact, Japan has recently really been on the suffering end of this strategy, with their net exports have seeing a downturn due to this paradigm. China (along with the US), seeking higher returns on investments, invest in Japan. Logically, Japan increases its imports of Chinese goods and services. In fact, foreign direct investment (FDI) skyrocketed last month from China to Japan:

“The rise in outbound FDI in January was led by a 500 percent jump in investment in Japan, the ministry said without elaborating.”

Trading Economics (and Fed) shows data on Japan’s balance of trade over the past year (see below). Notice how after China’s 500% investment jump in January, leads to a heavy drop in Japan’s balance of trade that same month:

So things do look troubling in Japan. A good question you might be asking yourself: is the US being affected by this too? The short answer is yes. Even as the world’s richest country, we rank 2nd to China in exports as of 2012 (latest data). In fact, it makes plenty of sense that China is ranked 1st in exports.

Intellectual Property Protection

So this strategy seems like a trouble inducing arms race for lower interest rates across many countries. Is there anything else the US or other countries could do to improve its exports? Yes, especially for the US! The United States could protect its IP abroad. It certainly does have a lot of unique valuable exports that other countries demand. Some high demand products come from the entertainment (movies, music, etc) and technology industry (machinery, electronics, etc). But both of these products don’t get their fair share of purchases because of heavy media pirating and patented designs being exploited or stolen (ex: iPhone). Enforcing piracy and protection at home and especially abroad has been a difficult challenge that the country is still trying to resolve. This is an area that I think deserves more attention.

While all of this would help us recover from the economic downturn and have a healthy GDP, we would be doing a disservice to the “victim” countries by competing with their local businesses (shifting the supply curve upward) and enforcing protection of IP. If performing such actions cripples another nation’s economy, this has negative moral and political repercussions that shouldn’t be taken lightly. I think its important to realize what could be done to provide solutions, not necessarily to impulsively act upon them.

Quartz #46—>One of the Biggest Threats to America's Future Has the Easiest Fix

Link to the Column on Quartz

Here is the full text of my 46th Quartz column, coauthored with Noah Smith, “One of the biggest threats to America’s future has the easiest fix,” now brought home to supplysideliberal.com. (I expect Noah will post it on his blog Noahpinionas well.) It was first published on February 4, 2014. Links to all my other columns can be found here.

Writing this column inspired a presentation on capital budgeting I gave at the Congressional Budget Office. See my post “Capital Budgeting: The Powerpoint File.”

If you want to mirror the content of this post on another site, that is possible for a limited time if you read the legal notice at this link and include both a link to the original Quartz column and the following copyright notice:

© February 4, 2014: Miles Kimball, as first published on Quartz. Used by permission according to a temporary nonexclusive license expiring June 30, 2015. All rights reserved.

Noah has agreed to allow mirroring of our joint columns on the same terms as I do, after they are posted here.

I talked about some of the issues of capital budgeting addressed in this column a while back in my post “What to Do When the World Desperately Wants to Lend Us Money” and Noah has talked about the importance of infrastructure investment a great deal on his blog .

Other Threats to America’s Future: Our editor wanted to title the column “The biggest threat to America’s future has the easiest fix.” I objected that I didn’t think it was the very biggest threat to America’s future. I worry about nuclear proliferation. Short of that, I believe the biggest threat to America’s future is letting China surpass America in total GDP and ultimately military might by not opening our doors wider to immigration—a threat I discuss in my column “Benjamin Franklin’s Strategy to Make the US a Superpower Worked Once, Why Not Try It Again?”


In the 1990s, with its economy stagnating after a financial crisis, Japan lavished billions on infrastructure investment. The Japanese government lined rivers and beaches with concrete, turned parks into parking lots, and built bridges to nowhere. The splurge of spending may have allowed Japan to limp along without a full-blown depression, but added to the mountain of government debt that remains to this day.

Given Japan’s experience, it may seem odd for us to call for an increase in America’s infrastructure investment. In terms of infrastructure, the US now is not Japan in the 1990s. They didn’t need to build … but we do.

First, the United States is a lot larger than Japan, and larger than the densely populated countries of Europe. We have a lot more ground to cover with highways, bridges, power lines, and broadband infrastructure. We need to be spending a higher fraction of our GDP on these transportation and communication links—but instead, we spend about the same or less.

Second, where Japan’s infrastructure was in good condition when the spending binge started, America’s infrastructure is in hideous disrepair. The American Society of Civil Engineers gives America’s infrastructure a “D+”. Although infrastructure opponents typically dismiss the opinions of civil engineers (who, after all, stand to personally gain from increased infrastructure spending), McKinsey released a recent report saying much the same thing. McKinsey notes that Japan is spending about twice as much as it needs to on infrastructure. But the US is spending only about three-fourths of what we should be spending. The Associated Press piles on, saying that 65,000 American bridges are “structurally deficient.” A former secretary of energy says our power grid is at “Third World” levels. The list of infrastructure woes goes on, and on, and on.

This is not the picture of a country with a healthy infrastructure.

We need to rebuild our infrastructure, and now is the perfect time to do it. Interest rates are at historic lows, but they are unlikely to stay there forever. Our government has a unique opportunity to borrow cheaply to fund infrastructure projects that will generate a positive return for the country. (If the increased spending acts as a Keynesian “stimulus,” so much the better.)

But infrastructure budgets have been cut, not expanded. Why? One reason is that in the race to cut the deficit, infrastructure spending has been lumped in with other types of spending. That is a tragic mistake. Unlike government “transfers,” which simply take money from person A and give it to person B, infrastructure leaves us with something that helps the private sector do business, and thus boosts our GDP growth. Infrastructure is a small percentage of overall federal spending, but tends to be a politically easy target.

One idea to boost infrastructure spending, therefore, is to treat government investments differently from other kinds of government spending by having a separate capital budget.  A separate capital budget has been suggested, but so far, the effort has foundered. There is a lot of confusion over which types of spending represent an “investment in the future.” Some politicians tend to argue that almost anything that helps people is an investment in the future, and so is a legitimate part of a capital budget. But of course everything in the government’s budget is something that someone thinks will help people!  So what is needed is a clear criterion to determine what should be in the capital budget and what should be in the regular budget.

There should be a fairly stringent set of criteria for what belongs in a capital budget. Furthermore, these criteria should appeal to both parties. Here is what we suggest as criteria to keep the capital budget “pure”:

1.     If experts agree that an expenditure will raise future tax revenue by increasing GDP, then it belongs in the capital budget. If it can pay for itself entirely out of extra tax revenue in the future then it should be 100% on the capital budget. If it can pay for half of its cost out of extra tax revenue in the future, than it should be 50% on the capital budget. The provision “experts agree” requires some sort of independent commission doing an economic analysis with appointees from both parties, and with, say, two-thirds of the commissioners needing to agree that the value of future tax revenue is likely to be above a given level.

2.     Even if an expenditure will not raise future tax revenue, it can count as a capital expenditure if it is a one-time expenditure—that is, if it makes sense to have a surge in spending followed by a much lower maintenance level of spending in that area. This will only be true if it pushes the existing stock of infrastructure, other government capital, or knowledge to a higher level than before, not if it just keeps things even. Crucially, by this logic, anything that lets the stock of infrastructure or other government capital decline would count as anegative capital expenditure. This principle enables the capital budget accounting to sound a warning when the nation is letting its infrastructure crumble away, and also allows sensible decisions about shifting funds from older forms of infrastructure toward modern forms of infrastructure needed by a fast-moving economy.

As our mention of the stock of knowledge suggests, a capital budget can also be a good way to make sure that America doesn’t underinvest in basic scientific research. However great the importance of better roads and bridges, it makes sense to weigh the benefits of those roads and bridges against the benefits of research that might someday conquer Alzheimer’s disease, or research on how to make the way math is taught in our public schools so exciting that every high school graduate in America is able to do the math needed to, say, operate computerized machine tools.

With proposals like these on the table, we believe there is a chance that Republicans and Democrats could agree to set infrastructure and other legitimate capital spending aside as an issue that should not be a victim of titanic political battles over the deficit. Of course, someday, if we find ourselves in Japan’s position of spending so much on infrastructure that it starts adding significant amounts to the debt, then the capital budget should become an issue in deficit fights as well. But we are far from that point.

Both Republicans and Democrats want to govern a country that is as rich and prosperous as possible. America’s businesses need good infrastructure to move their goods from place to place—and there is no question that we need the solid new ideas that research can provide. Economists of all stripes will agree that if a nation is under-spending on infrastructure and other legitimate capital spending—as America is right now —then boosting that spending is a win-win. It’s time to look beyond our fights over how to divide America’s pie, and focus on making the pie bigger.


Technical Afterword

There is a very interesting feature to our proposed capital budgeting system that we should highlight. How can the capital budget ever be negative? The capital budget plus the non-capital budget must add up to the total budget. So for a given total budget, a negative capital budget makes the non-capital budget bigger. What is going on is this: regular maintenance is like a quasi-entitlement within the non-capital budget. In any given year, regular maintenance as a component of the non-capital budget is fixed in advance and can’t be altered by the legislature. The only way it changes is that it is gradually reduced if the quantity of capital to be maintained gets lower, or gradually increased if the amount of capital to be maintained gets bigger.

In this lack of discretion about regular maintenance as a component of the non-capital budget, there is no real tying of the hands of the legislature: they could always choose to have a very negative capital budget, which would increase the non-capital budget enough to cover that maintenance. So if the legislature as a whole acted like a fully rational actor, this principle is not a constraint at all. But as political economy, it makes a difference, and a good one. The legislature can increase the non-capital budget and reduce the capital budget. But what the legislature can’t do is get more funds for other things by letting capital decay without it showing up in the accounting as an increase in the regular budget and reduction in the capital budget.

On these technical issues, see also

John Locke: Revolutions are Always Motivated by Misrule as Well as Procedural Violations

Jack Rakove, writes in his book Revolutionaries: A New History of the Invention of America(p. 309): 

In a key passage, Locke defined the prerogative of the executive not in terms of the time-encrusted powers of a king, but rather as a discretionary power to act “for the public good, without the prescription of the law, and sometimes even against it.” To this definition he added a shrewd observation: “Whilst employed for the benefit of the community, this true use of prerogative never is questioned: for the people are seldom or never scrupulous or nice in the point.”

This matches what I have seen in Department politics. By and large, as long as almost all the faculty agree with the results of a Department Chair’s actions, they tend to overlook procedural violations. It is only when they think that the Chair’s decisions are mistakes that the professors harp on the infringement of the faculty members’ right to be consulted. On the other hand, I have seen the combination of enough perceived mistakes and procedural violations lead to the academic small-time equivalent of revolution.

The key to avoiding the perception of misrule is to make sure to know and fully take into account in one’s decisions what people want–especially what those with the ability to influence what others want.

Note: Everything I say here is descriptive (“positive”) rather than prescriptive (“normative”). There is a danger that comes from setting bad precedents about violating procedures that is not always fully taken into account. On the other hand, though I am deeply committed to constitutional government, one cannot avoid the logical possibility that a set of bylaws or constitutional rules inherited from the past might be too much of a straitjacket.

Quartz #45—>Actually, There Was Some Real Policy in Obama's Speech

blog.supplysideliberal.com tumblr_inline_n1vghxmSa41r57lmx (1).png

Link to the Column on Quartz

Here is the full text of my 45th Quartz column, “Actually, there was some real policy in Obama’s speech,” now brought home to supplysideliberal.com. It was first published on January 29, 2014. Links to all my other columns can be found here.

If you want to mirror the content of this post on another site, that is possible for a limited time if you read the legal notice at this link and include both a link to the original Quartz column and the following copyright notice:

© January 29, 2014: Miles Kimball, as first published on Quartz. Used by permission according to a temporary nonexclusive license expiring June 30, 2015. All rights reserved.


In National Review Online, Ramesh Ponnuru described last night’s State of the Union speech as “… a laundry list of mostly dinky initiatives, and as such a return to Clinton’s style of State of the Union addresses.” I agree with the comparison to Bill Clinton’s appeal to the country’s political center, but Ponnuru’s dismissal of the new initiatives the president mentioned as “dinky” is short-sighted.

In the storm and fury of the political gridiron, the thing to watch is where the line of scrimmage is. And it is precisely initiatives that seem “dinky” because they might have bipartisan support that best show where the political and policy consensus is moving. Here are the hints I gleaned from the text of the State of the Union that policy and politics might be moving in a helpful direction.

  • The president invoked Michelle Obama’s campaign against childhood obesity as something uncontroversial. But this is actually part of what could be a big shift toward viewing obesity to an important degree as a social problem to be addressed as communities instead of solely as a personal problem.
  • The president pushed greater funding for basic research, saying: “Congress should undo the damage done by last year’s cuts to basic research so we can unleash the next great American discovery.” Although neither party has ever been against support for basic research, budget pressures often get in the way. And limits on the length of State of the Union addresses very often mean that science only gets mentioned when it touches on political bones of contention such as stem-cell research or global warming. So it matters that support for basic research got this level of prominence in the State of the Union address. In the long run, more funding for the basic research could have a much greater effect on economic growth than most of the other economicpolicies debated in Congress.
  • The president had kind words for natural gas and among “renewables” only mentions solar energy. This marks a shift toward a vision of coping with global warming that can actually work: Noah Smith’s vision of using natural gas while we phase out coal and improving solar power until solar power finally replaces most natural gas use as well. It is wishful thinking to think that other forms of renewable energy such as wind power will ever take care of a much bigger share of our energy needs than they do now, but solar power is a different matter entirely. Ramez Naam’s Scientific American blog post “Smaller, cheaper, faster: Does Moore’s law apply to solar cells“ says it all. (Don’t miss his most striking graph, the sixth one in the post.)
  • The president emphasized the economic benefits of immigration. I wish he would go even further, as I urged immediately after his reelection in my column, “Obama could really help the US economy by pushing for more legal immigration.” The key thing is to emphasize increasing legal immigration, in a way designed to maximally help our economy. If the rate of legal immigration is raised enough, then the issue of “amnesty” for undocumented immigrants doesn’t have to be raised: if the line is moving fast enough, it is more reasonable to ask those here against our laws to go to the back of the line. The other way to help politically detoxify many immigration issues is to reduce the short-run partisan impact of more legal immigration by agreeing that while it will be much easier to become a permanent legal resident,citizenship with its attendant voting rights and consequent responsibility to help steer our nation in the right direction is something that comes after many years of living in America and absorbing American values. Indeed, I think it would be perfectly reasonable to stipulate that it should take 18 years after getting a green card before becoming a citizen and getting the right to vote—just as it takes 18 years after being born in America to have the right to vote.
  • With his push for pre-kindergarten education at one end and expanded access to community colleges at the other end, Obama has recognized that we need to increase the quantity as well as the quality of education in America. This is all well and good, but these initiatives are focusing on the most costly ways of increasing the quantity of education. The truly cost-effective way of delivering more education is to expand the school day and school year. (I lay out how to do this within existing school budgets in “Magic Ingredient 1: More K-12 School.”)
  • Finally, the president promises to create new forms of retirement savings accounts (the one idea that Ramesh Ponnuru thought was promising in the State of the Union speech). Though this specific initiative is only a baby step, the idea that we should work toward making it easier from a paperwork point of view for people to start saving for retirement than to not start saving for retirement is an idea whose time has come. And it is much more important than people realize. In a way that takes some serious economic theory to explain, increasing the saving rate by making it administratively easier to start saving effects not only people’s financial security during retirement, but also aids American competitiveness internationally, by making it possible to invest out of American saving instead of having to invest out of China’s saving.

Put together, the things that Barack Obama thought were relatively uncontroversial to propose in his State of the Union speech give me hope that key aspects of US economic policy might be moving in a positive direction, even while other aspects of economic policy stay sadly mired in partisan brawls. I am an optimist about our nation’s future because I believe that, in fits and starts, good ideas that are not too strongly identified with one party or the other tend to make their way into policy eventually. Political combat is noisy, while political cooperation is quiet. But quiet progress counts for a lot. And glimmers of hope are better than having no hope at all.

John Stuart Mill: In Praise of Eccentricity

In On Liberty, Chapter III: “Of Individuality, as One of the Elements of Well-Being,” paragraph 13, John Stuart Mill writes:

In this age, the mere example of nonconformity, the mere refusal to bend the knee to custom, is itself a service. Precisely because the tyranny of opinion is such as to make eccentricity a reproach, it is desirable, in order to break through that tyranny, that people should be eccentric. Eccentricity has always abounded when and where strength of character has abounded; and the amount of eccentricity in a society has generally been proportional to the amount of genius, mental vigour, and moral courage which it contained. That so few now dare to be eccentric, marks the chief danger of the time.

Kathryn Schultz: Consumer Debt in the Short Run and in the Long Run

This is a guest post from Kathryn Schultz, one of the students in my “Monetary and Financial Theory” class at the University of Michigan.


Everyone has had that one credit card bill that they’ve opened up and cringed at the amount due. But how can such small purchases add up so quickly in only a month? Most people don’t realize just how much money they are spending when they use a credit card to buy their purchases. However, most of the debt in our country comes from consumer spending. Since consumer spending drives the economy and fuels nearly 70% of U.S. GDP, it is important for consumers to be in a sound financial position. If consumers become overburdened with debt, they will not be able to drive economic growth. The table below shows the total amount of household debt, total nominal GDP, total nominal disposable personal income, and the ratio of household debt to both GDP and disposable personal income; all the numbers are in billions of dollars:

As you can see, over the past 30 years, U.S. consumers have increased both total household debt and the percentage of that debt relative to overall GDP and DPI. At some level, the total amount of debt can become so large that it can force consumers to slow their spending and thus begin to negatively affect the health of the economy. This is why in times of a recession, governments try to encourage consumer spending by lowering taxes and lowering interest rates. When consumers slow down their purchases, business’ profits are lowered which eventually lead to lay-offs; worsening the downward spiral. The more debt that is held, the less money is available to be put away in savings and reinvested in the economy.

After 2009, consumer debt began to slowly decline for the next few years. Recently however, since the beginning of 2013, Americans have been taking on debt at a rate not seen since the country spiraled into the Great Recession. Consumer debt increased in just the fourth quarter of 2013 by $241 billion, the largest quarter to quarter increase since 2007. Below is a graph of the quarter to quarter household debt balance since 2003 and its composition:

blog.supplysideliberal.com tumblr_inline_n1qg5nsq1j1r57lmx.png

This total debt balance was a combination of Americans boosting credit card balances, increasing borrowing to buy more homes and cars, and taking on more student debt. Balances on credit card accounts alone increased $11 billion during the fourth quarter, making it the third largest source of household indebtedness. Only the mortgage and student loan debt markets were larger.

You would have thought that after the chaos of the recession, we would have become better at keeping track of our debt. However, data shows otherwise. According to a survey released by Bankrate.com, 28% of Americans have more credit card debt today than they have in a savings fund. This means that over a quarter of Americans wouldn’t be able to pay off their debt even if they used their entire savings! But, despite consumers’ savings records, banks are loosening up their credit card limits to levels not seen since the recession. This easy access to credit along with low interest rates during boom years is what brings Americans to take on record levels of debt. This does not mean that we are on the road to a second recession however. Americans’ increase in household debt could actually have to do with increased consumer confidence in the economy as it relatively improves. Higher spending leads to more jobs and higher incomes, which ultimately leads to higher consumer spending. For consumers with extra money in their wallets, taking on more debt may not seem so risky. And, as we know, consumer spending puts the economy on a positive track.

So can this notion that “Americans are spending way too much” be curbed and should it be? Financial advisers offer several tips on how to stop spending so much money and get back on track financially. Two of these tips include tracking your cash flow and tapping into your feelings to restrain your urge to spend. There is a difference between needing something and wanting something, and budgeting helps you to see areas where you may be overspending. Therapist Nancy Irwin says that overspending tends to be a coping mechanism. “You need to find the underlying issue that is trying to be fixed by overspending and learn how to deal with it in a healthy manner. There is nothing wrong with keeping up with the latest trends or being indulgent from time to time, as long as the intent is in the right place.” There is a fine line between spurring growth and digging the nation deeper into an economic sinkhole if too many houses are burdened with debt. Before you hand over your credit card, you need to think twice. You should ask yourself what need you are trying to fulfill and if you are going to be able to pay it off when the bill comes in the mail.

The Irresistability of Market Forces in 1890 New York City

In his book American Colossus: The Triumph of Capitalism 1865-1900, H. W. Brands tells the story of Danish-American photographer and journalist Jacob Riis, who wrote How the Other Half Lives. From H. W. Brands, pp. 296 and 298:  

“The law has done what it could,” Jacob Riis wrote… Riis had found his way back to New York as a journalist, a first of the breed of investigators derided, then respected, as “muckrakers.” The label fit Riis particularly, for his investigations focused on the lives of those on the mudsill of society. Having dwelt there himself, he felt compelled to bring the plight of the lower classes to view. “Long ago it was said that ‘one-half of the world does not know how the other half lives,’” he wrote in 1890. “That was true then. It did not know because it did not care.” It might not care still had the life of the lower half not intruded increasingly on that of the upper. Peasants in the Old World could starve invisibly, far from the manor; poverty in America elbowed wealth every day on the streets of New York and other cities.

Yet wealth looked away and hurried by. Riis proposed to make it stop and look….

The Riis tour continued to “The Bend” of Mulberry Street, the most noisome of New York’s slums. Here reformers had been at work for decades, trying to enforce the housing laws; here they had consistently discovered that the laws of supply and demand trumped the statutes of mere legislators. Landlords resisted the changes, claiming the right of property to a profit. Tenants resisted, for fear of displacement by the higher rents the changes would produce. Nature, it seemed, or at any rate capitalism, conspired to populate every nook and cranny of the Bend. “Incessant raids cannot keep down the crowds that make them their home. In the scores of back alleys, of stable lanes and hidden byways, of which the rent collector alone can keep track, they share such shelter as the ramshackle structures afford with every kind of abomination rifled from the dumps and ash-barrels of the city”

Capitalism had created the Bend, and it thrived within the Bend.

Justin Briggs and Alex Tabarrok: Fewer Guns, Fewer Suicides

blog.supplysideliberal.com tumblr_inline_mxsvuuqBTj1r57lmx.png

Justin Briggs and Alex Tabbarok have a new paper providing evidence about guns and suicides. Here are some of the highlights from their blog post on that research, “It’s Simple: Fewer Guns, Fewer Suicides”:

Reverse Causality Not a Big Issue

Places with lots of guns may have high homicide rates, but is this because guns cause homicide or because homicides cause people to buy guns? Or could a third factor—say, a general lack of social trust or high violence in a region—be causing both homicides and gun possession? The relationship between suicides and guns is much easier to tackle because it’s unlikely that an increase in the number of suicides in a community would cause an increase in local gun ownership.

Much Less than Perfect Substitution into Other Modes of Suicide

…a percentage-point decrease in household gun ownership leads to between 0.5 and 0.9 percent fewer suicides….While reduced household gun ownership did lead to more suicides by other means, suicides went down overall. That’s because contrary to the “folk wisdom” that people who want to commit suicide will always find a way to get the job done, suicides are not inevitable. Suicides are often impulsive decisions, and guns require less forethought than other means of suicide—and they’re also deadlier.

Natural Experiment 1: Australian Gun Control Led to Fewer Gun Suicides

…following the 1996 killing of 35 people in Port Arthur, Australia, a strong movement for gun control developed in Australia. … these changes resulted in a reduction of the country’s firearm stock by 20 percent, or more than 650,000 firearms, and evidence suggests that it nearly halved the share of Australian households with one or more firearms. The effect of this reduction was an 80 percent fall in suicides by firearm, concentrated in regions with the biggest drop in firearms. Meanwhile there was little sign of any lasting rise in non-firearm suicides.

Natural Experiment 2: Prohibiting Soldiers from Taking Guns Home over the Weekend Led to Fewer Total Gun Suicides

In Israel most 18- to 21-year-olds are drafted into the Israeli Defense Forces and provided with military training—and weapons. Suicide among young IDF members is a serious problem. In an attempt to reduce suicides, the IDF tried a new policy in 2005, prohibiting most soldiers from bringing their weapons home over the weekends. Dr. Gad Lubin, the chief mental health officer for the IDF, and his co-authors estimate that this simple change reduced the total suicide rate among young IDF members by a stunning 40 percent. It’s worth noting that even though you might think that soldiers home for the weekend could easily delay suicide by a day or two, the authors did not find an increase in suicide rates during the weekdays.

If Lives Lost by Suicide are Valued at $8.4 Million Each, What is the Suicide Cost of a Gun?

Considering the value of life tells us that the true price of guns is higher than the monetary price by at least $2,635, the amount needed to be able to compensate for the expected loss of life.

On the Great Recession

I am honored to have David Andolfatto discuss my proposal for eliminating the zero lower bound in his post “Are negative interest rates really the solution?” David asks what model I have in mind when I write, for example, in “America’s Big Monetary Policy Mistake: How Negative Interest Rates Could Have Stopped the Great Recession in Its Tracks," 

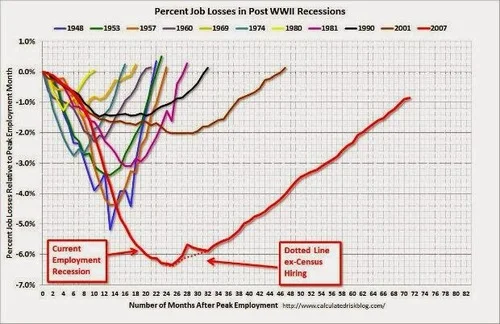
Even without the ZLB [the zero lower bound on nominal interest rates], there would have been some hit from the financial crisis that ensued with the bankruptcy of Lehman Brothers on Sept. 15, 2008, but negative interest rates in the neighborhood of 4% below zero would have brought robust recovery by the end of 2009.

This post gives that model. 

One thing I will not try to do in this post is to talk about how we have actually been crawling out of the hole left by the great recession using the low-power, but not powerless tool of quantitative easing. Among instruments of monetary policy, this post considers only the current short-run safe interest rate. (I discuss some of the downsides of quantitative easing relative to negative interest rates in my ”Breaking Through the Zero Lower Bound" Powerpoint file.)

Related Work 

It is a model that I have taught in my advanced undergraduate course “Business Cycles” since the mid-90’s (see scans of student notes for two different years 1, 2), building on my academic papers

(My “Business Cycles” course is Economics 418 at the University of Michigan. Masao Ogaki has also arranged for me to teach it at Keio University in Tokyo, in August 2014.)

I am currently working on a formal treatment of the kind of issues I will address here with Bob Barsky and Rudi Bachmann. Blogging has brought home to me the policy importance of pushing that paper through to completion. We do not have a full draft yet, but if you want to see the kind of model it is, here is a mathematical appendix I put together early on in our process of writing that paper

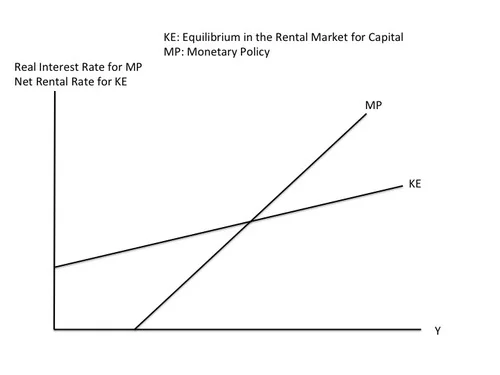
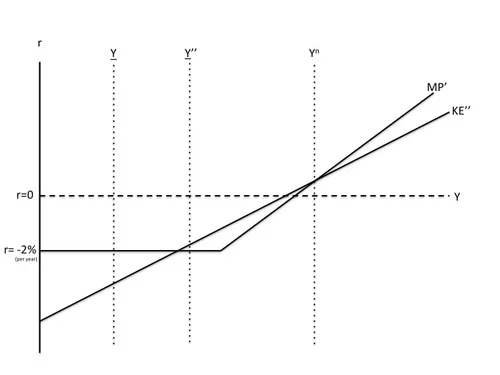
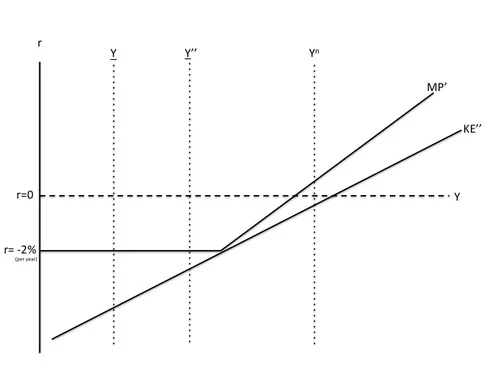
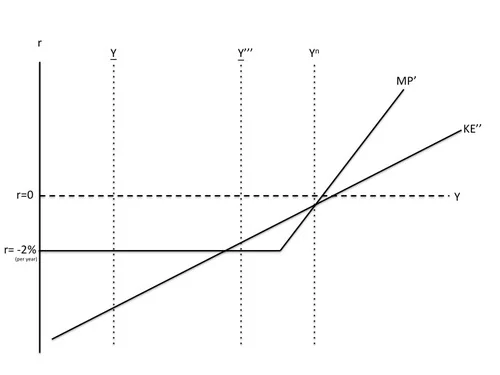
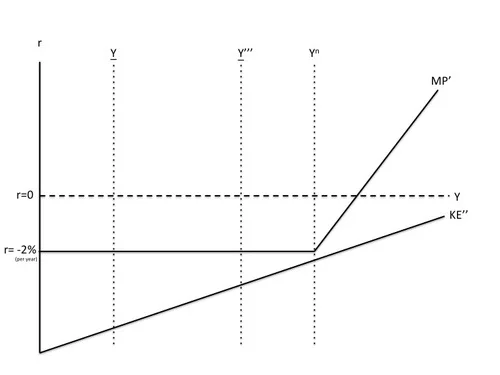
But to understand what I am going to say, you don’t need to read the academic papers I flag above. The only indispensable prerequisite for understanding what I am going to say beyond a general background in economics is to read my post “The Medium-Run Natural Interest Rate and the Short-Run Natural Interest Rate,” where I discuss why I reject the IS-LM model on theoretical grounds, using instead the soundly micro-founded KE-MP model.

The Argument for Sticky Prices, Sticky Wages or Sticky Information or Sticky Information Processing Relevant to Prices and Wages

I am claiming that the KE-MP model is soundly “micro-founded,” but “micro-founded” is of course always a matter of degree. The Arrow-Debreu model is not fully micro-founded because it does not explain how the contracts at its heart are enforced! In the case of the KE-MP model, the place where the micro-foundations do not go as deep as one might wish is in explaining why prices are determined in the way they are. I consider the evidence of substantial monetary nonneutrality (from Friedman and Schwartz, from Romer and Romer, from vector auto-regressions, from the experience of central bankers even after allowing for some of the likely psychological biases, etc.) very persuasive. Despite many attempts, models without sticky prices, sticky wages or some kind of sticky information or sticky information processing relevant for prices and wages have not been very successful at explaining substantial monetary nonneutrality. (In saying this, I am leaving aside models that, in their totally real versions, have multiple equilibria; it is of course easy to have nominal things help select among multiple real equilibria.) Thus, regardless of the qualms one might have about why prices might be sticky (or wages, or information relevant to prices and wages), it is appropriate to assume something that is the moral equivalent of sticky prices in the broad sense.

Many people do not realize that there is another very powerful strand of evidence for something like sticky prices: the observed response of the economy to technology shocks. In “Are Technology Improvements Contractionary?”Susanto Basu, John Fernald and I make a careful, extensive, and I believe persuasive, argument that the observed response of the economy to technology shocks is very hard to square empirically with models that lack something like sticky prices, sticky wages or sticky information or sticky information processing relevant to prices and wages. I have been disappointed in the years since it was published that this aspect of our paper–this argument for sticky prices or the like–has had as little influence as it has. (Of the many citations the paper has, the bulk appear to be from economists who are simply eager to use our measure of technology shocks.)   

As for the empirical evidence behind "Are Technology Improvements Contractionary?“, it is nice to know that our evidence based on purifying Solow Residuals of variable capital and labor utilization and increasing returns to scale to identify technology shocks is backed up by the very different methodology of structural vector autoregressions of aggregate hours and output, beginning especially with Jordi Gali’s paper ”Technology, Employment, and the Business Cycle: Do Technology Shocks Explain Aggregate Fluctuations?“ (which was actually contemporaneous with our work in ”Are Technology Improvements Contractionary?“ in its inception, but was completed much more quickly than our paper), and ably defended by John Fernald in his paper Trend Breaks, Long-Run Restrictions, and Contractionary Technology Improvements.

One of the important contributions of ”Are Technology Improvements Contractionary?“ is to focus on the evidence that technology improvements are contractionary for business investment as well as for labor hours. That evidence for a contractionary effect on business investment of immediate permanent technology shocks, is actually much more decisive as evidence for something like sticky prices than the evidence of a contractionary effect on hours. (Note that if technology improvements are anticipated in advance, in a real business cycle model they should make both investment and hours increase at the moment when the technology actually improves. But both investment and hours decline when the technology is observed to improve.)

I should mention in passing that the response of the economy to technology shocks only provides evidence for sticky prices because the monetary policy response to technology shocks is suboptimal. An optimal monetary policy response to technology shocks should strive to make the economy behave like the real business cycle model corresponding to perfectly flexible prices. (In my column "Show Me the Money” I discuss the importance of monetary policy responses to tax policy changes as well as technology shocks.)

Sluggish Inflation

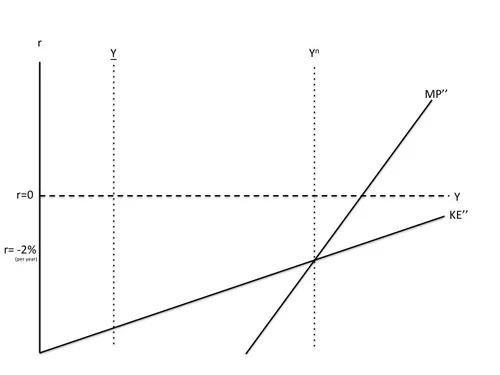
In the graphs I present below, I will treat inflation as being relatively sticky and unchanging. I was clued into the importance of sluggishly changing inflation by Michael Kiley’s job talk at the University of Michigan in 1995 and presented my own (never published) model to generate that kind of behavior at a seminar at Harvard in May, 2000. But given the premium on actually publishing things in academic journals, I gave this account of those ideas in my post “Trillions and Trillions: Getting Used to Balance Sheet Monetary Policy”:

I take the idea that inflation adjusts gradually from my main graduate school advisor Greg Mankiw, one of the most eminent New Keynesians: both from his textbook where he gives his view of the facts and from his theoretical 2002 paper with Ricardo Reis trying to explain those facts: “Sticky Information Versus Sticky Prices: A Proposal to Replace the New Keynesian Phillips Curve.”Michael Kiley anticipated Mankiw and Reis in his 1995 job market paper. He used the nice phrase “sluggish inflation” to describe what he was explaining with his model. 

The thing I emphasize to my graduate students is that if inflation is sticky, as distinct from the price level being sticky, that some kind of imperfect information processing must be involved. Why? Let’s think of a continuous-time model–or it is good enough to think of a model with 365 periods per year–for clarity. Inflation yesterday was generated by the firms that changed their prices yesterday. But with staggered price setting, the firms that were changing their price yesterday are different firms than the one that are changing their prices today. So, other than having a similar information environment, there is nothing connecting inflation yesterday to inflation today. If firms are optimally using all available information, and something big happens between yesterday and today, then inflation should jump, since the optimal price to change to today should generally be different than the optimal price to change to yesterday. (I am assuming that the old price firms are changing from is changing gradually at that juncture.) To make inflation not jump when something important happens requires firms today somehow not fully using that new information. That is, there has to be some form of imperfect information processing. Mankiw and Reis model the imperfect information processing as firms being asleep relative to new information and making up price changes based on old information much of the time, then periodically updating the information set they are using in full

The key evidence for sluggish inflation is how costly it seems to be to reduce inflation. Paul Krugman gives a nice (though as usual, combatively framed) description of the relevant historical episode in his very interesting post “Fighting the Last Macro War?”:

So, what were the macro wars of the last few decades? First there was stagflation — and that did indeed knock Keynesians back for a while, even as it gave freshwater macro some credibility. As I’ve already indicated, the freshwater guys then stopped there. And I mean really, really stopped there: in many ways they seem to be forever living in 1979.

In particular, they never reacted at all to the second macro war, the disinflation of the 1980s. The point there was that disinflation was very costly, with protracted high unemployment — which shouldn’t have happened if freshwater macro were at all right. This reality, as much as clever new models, drove the Keynesian revival …

What Paul doesn’t say there, but I think would agree with, is that costly disinflation is not only evidence for monetary nonneutrality, but also evidence against something as simple as the usual Calvo model of price setting, which has sticky prices, but jumping inflation. Indeed, Larry Ball among others pointed out that the Calvo model implies that disinflation brought on by a gradual reduction in the growth rate of the money supply should cause a boom if price setting were as in the usual Calvo model of price setting.

In any case, though the usual Calvo model might be OK for some pedagogical purposes, it is seriously flawed as a representation of reality in any context in which it might matter whether inflation is sluggish or not. For a recent, brief discussion of evidence for sluggish inflation in the context of the Great Recession, see Bob Hall’s strong words in “The Routes into and out of the Zero Lower Bound”:

The historical pattern is that a rise in unemployment generates a transitory decline in inflation, but the rise wears off quite quickly, and an extended period of high unemployment|as in the U.S. since 2007 has no effect on inflation.

(Note: I am not persuaded by Bob Hall’s story for why inflation has not fallen faster during the Great Recession.)
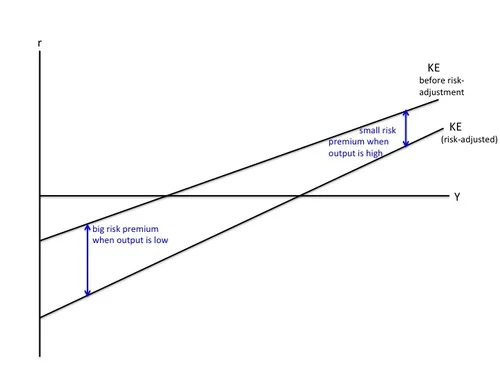
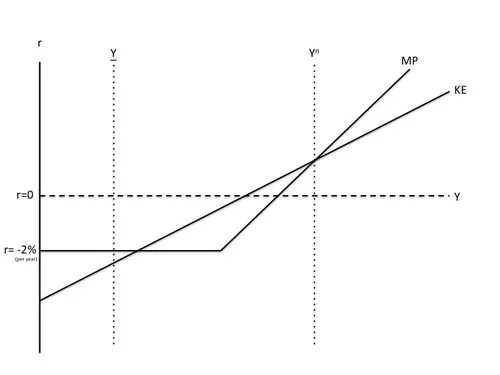
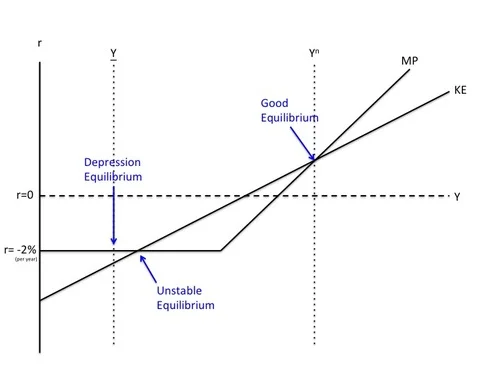
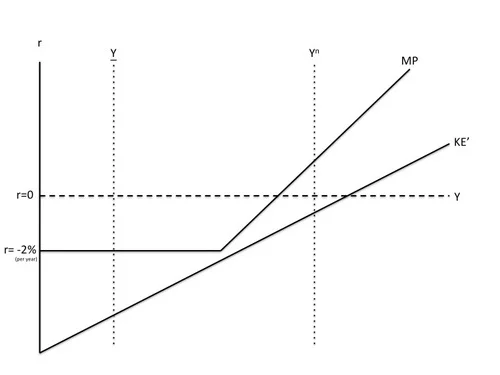
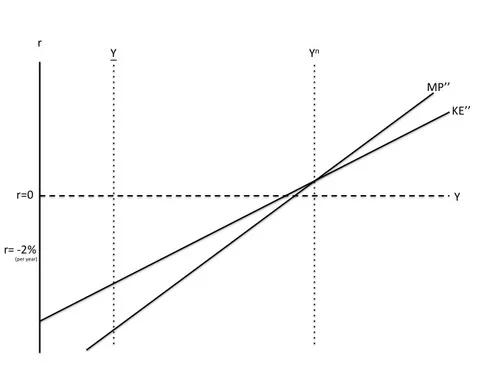
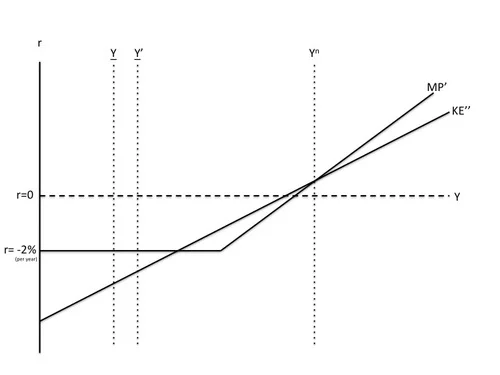
The KE-MP Model

I build the KE-MP model in “The Medium-Run Natural Interest Rate and the Short-Run Natural Interest Rate.” So far, this is the version without a zero lower bound.

The MP curve is simply the monetary policy rule, which says that at its regular meetings (every six weeks or so for the Fed) the monetary policy committee will raise the target interest rate if output is higher than at the last meeting and lower the target interest rate the Fed will raise the target interest rate if output is lower than at the last meeting.

The KE curve shows what happens as a result of equilibrium in the capital rental market. The key point is that firms will be willing to pay more to rent capital when the economy is in a boom than when the economy is in recession. Therefore, the rental rate for capital is an upward-sloping function of output. (As I discuss in The Quantitative Analytics of the Basic Neomonetarist Model, even adding a Q-theory-type investment-smoothing motive modifies this story less and less the longer-lasting a recession is. All the ins and outs of that kind of modification are one of the key issues addressed by the paper I am working on with Bob Barsky and Rudi Bachmann.)   

To begin with, think of short-run equilibrium as requiring that the short-term interest rate equal the rental rate net of depreciation. The reason is one that goes back to Dale Jorgenson: if the net rental rate is less than the real interest rate, then a firm would be better off waiting until later to invest. So it won’t invest now. If the net rental rate is higher than the real interest rate, then a firm should be eager to invest now (as long as a generic investment project meets the longer-run positive present-discounted value test–something that is guaranteed unless interest rates are expected to be above the net rental rate in the future). 

To give my view of the Great Recession, in addition to imposing the zero lower bound on the MP curve, I need to add one important wrinkle to the KE curve–a risk premium between the net rental rate and the safe interest rate. Because building a building, buying equipment or writing software or uncertain value is risky, the net rental rate actually needs to be higher than the safe short-term interest rate for a firm to invest now instead of later. Given that, I want the KE curve to represent not the net rental rate, but the risk-adjusted net rental rate–that is, the safe interest rate that is just low enough that, given the risk premium, would make firms indifferent between investing now and investing later. In many discussions with Tomas Hirst (see for example “Doubting Tomas: Electronic Money in an Open Economy with Wounded Banks”), he writes as if the relevant risk premium is infinite. In my model, it isn’t. And I don’t think the risk premium is infinite in the world either. There is some real interest rate low enough that firms will not want to delay investment until later. Nevertheless, the risk premium tends to (a) be lower in good times than in bad times, lending a higher slope to the risk-adjusted KE curve, and (b) to change for reasons other than the current level of output, causing shifts in the risk-adjusted KE curve.

The Risk-Adjusted KE Curve

To see why the relationship of the risk premium to the output gap makes the risk-adjusted KE curve more strongly upward-sloping, note that

  • at low levels of output (on the left in the graph just above), the risk-premium pushes the risk-adjusted KE curve a long way below the before-risk-adjustment KE curve

  • at high levels of output (on the right in the graph just above), the risk-premium pushes the risk-adjusted KE curve only a modest distance below the before-risk-adjustment KE curve.

From here on, the curve labeled “KE” will always be the risk-adjusted KE curve: the locus of safe short term rates that makes a typical firm indifferent between investing now and investing later on a generic investment project.   

Imposing the Zero Lower Bound on the MP Curve and Accounting for Sources of Aggregate Demand Other than Generic Investment Projects

I have written a lot about the zero lower bound and how to eliminate it. See my reader’s guide “How and Why to Eliminate the Zero Lower Bound" Graphically, since the real interest rate is the nominal interest rate minus expected inflation, if inflation is steady at 2% per year (the long-run inflation target for the Fed, the European Central Bank and the Bank of England, and currently the fond wish of the Bank of Japan), then the zero lower bound on the nominal interest imposes a lower bound of -2% per year on the real interest rate.

In addition to the KE and MP curves that govern generic investment, there is one other key element of the graph above: the level of output when generic investment is zero: Y(read "Y underbar”). When generic investment is zero, aggregate demand is composed of consumption, government purchases, net exports, and investment from special investment opportunities. 

For simplicity I am treating the special investment opportunities as so good that they will be pursued regardless of any changes in the risk-adjusted net rental rate or the real interest rate during this episode. Government purchases are exogenous. Consumption is determined by people’s views about the post-recession future according to the permanent income hypothesis. (The elasticity of intertemporal substitution in the model is low enough that interest rate effects on consumption can be ignored if interest rate fluctuations are short-lived.) If you want to think of this as a simplified model of the world economy, then net exports are zero. Alternatively, think of other country’s central banks matching most interest rate moves for the safe short-term rate, so that there is very little change in international capital flows or the closely linked value of net exports.

What is a generic investment project in the real world? I suspect it is building a house. Note that rental rates for housing, like rental rates for factories and machines, are likely to be higher in good times than in bad times. So there would still be an upward-sloping KE curve if house construction is the main component of “generic investment.” For this to work, it turns out to be crucial that house prices are sticky, even from at the moment construction commences on a house–as Bob Barsky, Chris House and I argue in our paper “Sticky Price Models and Durable Goods.” Thinking about it from the standpoint of theory, it is quite mysterious to me why house prices would be sticky, yet it seems consistent with the data to say that they are. If the typical generic investment project is building a house, then a key transmission mechanism for a typical recessions would be a partial or total shutdown of house construction.  

The 3 Equilibria in Normal Times

I am not in general a fan of multiple equilibrium models. Here, except for the zero lower bound, there would be only a single stable equilibrium. But the zero lower bound often creates two additional equilibrium. The rightmost intersection between KE and MP above is what I will call “the normal equilibrium” or “the good equilibrium.” (In the graph I have drawn the good equilibrium at the natural level of output Yn, which is where it will be in medium-run equilibrium.) The good equilibrium is the equilibrium that would remain in the absence of the zero lower bound (unless monetary policy were intentionally so tight as to push output down to Y). The good equilibrium is stable because

  • if output gets a little above that level, the central bank will raise the real interest rate above the risk-adjusted net rental rate, causing firms to start delaying investment projects that are not already underway, leading to a gradual decline in investment as investment projects already underway gradually get completed. That gradual downward adjustment of investment takes about nine months, and brings output back down to the short-run equilibrium level at the intersection of KE and MP. (See “Investment Planning Costs and the Effects of Fiscal and Monetary Policy" for the background for this gradual investment adjustment process.)

  • If output gets a little below that level, the central bank will lower the real interest rate below the risk-adjusted net rental rate, and firms will then be eager to do generic investment projects immediately–or as soon as they can be planned out. The extra aggregate demand from these additional investment projects will gradually cause output to rise back to the short-run equilibrium level at the intersection of KE and MP.

Notice that in this story, it is crucial for stability that the central bank raise its target interest more with changes in output than the rate at which the risk-adjusted net rental rate changes with changes in output. (This is a very different kind of stability issue than what is often emphasized in monetary models.) Not making the target interest rate go up strongly enough with output would lead to instability. And indeed, the intersection of the zero-lower-bound portion of the MP curve with the KE curve is an unstable equilibrium. Let me justify the label of "unstable equilibrium” that I have given to that point.

  • To the right of the intersection where the KE curve cuts the horizontal MP curve from below, the risk-adjusted net rental rate is above the real interest rate, which encourages more investment and raises leads to even higher output, leading ultimately to the normal equilibrium.

  • To the left of that intersection where the KE curve cuts the horizontal MP curve from below, the risk adjusted net rental rate is below the real interest rate, making firms want to delay all generic investment projects (according to Dale Jorgenson’s logic), leading to a decline in investment as projects already underway are completed, and a corresponding decline in output, which would only end when generic investment has been completely shut down, bringing output down to Y.

Finally at Y, there is a stable “depression equilibrium.” At that point, the risk-adjusted net rental rate is below the real interest rate, so firms want to delay all generic investment projects. Even if something made output go up a tad, the risk-adjusted net rental rate would still be strictly below the real interest rate, so firms would still want to delay all generic investment projects. With all generic investment projects delayed, output will be stuck at Y, which is the level of output that can be supported by aggregate demand from consumption, government purchases, net exports and special investment projects.

An Increase in the Risk Premium Leads to a Collapse of Generic Investment

In my model, there is no confidence fairy. Equilibrium selection is simple: once in one of the two stable equilibria, the economy stays in that equilibrium (with what ever adjustments occur to that equilibrium), unless the time comes when that equilibrium ceases to exist. The trouble is that, for a while at the end of 2008 and early 2009, the good equilibrium didcease to exist. For reasons that we understand at the same level that non-economists do, but do not understand at a deep theoretical level, the risk premium increased, and the KE curve therefore shifted down. Indeed, my view is that it shifted down enough that the the panic KE curve, labeled KE’, was everywhere below the MP curve, given the constraint imposed by the zero lower bound. With risk-adjusted net rental rate for generic investment projects everywhere below the real interest rate, generic investment began shutting down, and the economy headed toward the depression equilibrium.    

The Effects of Some Monetary Easing and Some Reduction in the Risk Premium, Subject to the Zero Lower Bound

Just above, I have drawn KE after some success of efforts to reduce the risk premium (labeling it KE’’) and MP after some monetary easing (labeling it MP’), but still subject to the zero lower bound. If all of this could have been done quickly enough, it might have been possible to get the risk-adjusted net rental rate above the real interest rate while the level of output was still above the unstable equilibrium at the intersection of the zero lower bound with the somewhat restored KE curve. But by the time these steps were completed, output was already below the level at the unstable equilibrium. Thus, the risk-adjusted net rental rate was already below the real interest rate, and the zero lower bound prevented the real interest rate falling enough to change that inequality. So the economy continued heading toward the depression equilibrium.

Eliminating the Zero Lower Bound and Going to Negative Interest Rates Leads to Recovery by the End of 2009 (What Could Have Been)

If there had been no zero lower bound, a straightforward shift downward in the MP curve to compensate for the increase in the risk premium could have kept the short-run equilibrium at the natural level of output. Here I have drawn a KE’’ curve a little higher than the KE’ curve was in order to represent some success of efforts to bring the risk premium back down, but that is not essential. However much the KE curve goes down, it is possible to shift the MP curve down just as much.

Of course, if the risk premium were going to stay high for years and years, that would have some effect on the natural level of output, but other than the delay condition highlighted in the KE-MP graph, it is only the time integral of the risk premium that matters. So a year or two of an elevated risk premium probably would not have a big effect on the natural level of output. And along with the bailouts that actually took place, and reasonable macroprudential efforts to avoid a repeat of the financial crisis, the economic recovery from effective monetary policy–unhindered by the zero lower bound–would probably have kept the effects on the risk premium quite reasonable in duration.

Let me make a few more points here. First, the reason I said the recession would be over by the end of 2009 is that it takes about 9 months for investment to adjust to changes in monetary policy. Second, there is no need to posit any technology shock to explain the Great Recession. Risk premia shocks indeed real shocks, but they differ from technology shocks in mattering for the natural level of output (the medium-run equilibrium) only in proportion to how long they are going to last. By contrast, as is well known from the Real Business Cycle literature, even a short-lived technology shock, if there were such a thing, would have a very powerful effect on the medium-run equilibrium. (In a real business cycle model, among things easy to draw in a phase diagram, a risk premium shock is more like a temporary shock to the utility discount rate.) Third, it is good to check in the graph just above that there is only one stable equilibrium; with the appropriate shift in the MP curve shown, that equilibrium is at the (mostly unchanged) natural level of output. Thus, the recession has been ended with more or less full recovery.  Finally, if the central bank doesn’t go to negative interest rates until later on, the capital stock is likely to have declined somewhat, reducing the natural level of output.

Bonus: Fiscal Policy in the KE-MP Model

I am done with my main message. And I consider fiscal policy markedly inferior as a way to deal with the kind of thing we faced in the last few years. But it is of some interest to see what the model here has to say about changes in government purchases. The first thing to say is that at the good equilibrium, increases in government purchases crowd out generic investment 1 for 1 in the short-run equilibrium. Because investment plans take time to adjust, speedy changes in government purchases could have an effect on the ultra-short-run equilibrium for about 9 months (as discussed in “Investment Planning Costs and the Effects of Fiscal and Monetary Policy”), but changes in government purchases that took just as long to plan would have no effect on output. (It is possible to get some longer-lasting effects of government purchases on output, but it requires putting more barriers in the way of adjustments in generic investment than the KE-MP model has.)

The Effects of an Increase in Government Purchases at the Zero Lower Bound

Once the economy is in the depression equilibrium, an increase in government purchases cannot crowd out generic investment because generic investment is already zero.  Thus, an increase in government purchases raises Y to Y’. For modest increases in government purchases (say, like the actual stimulus package), though this improves the depression equilibrium, it does not get the economy out of the depression equilibrium. But given some success at reducing the risk premium and loosening of monetary policy where possible above the zero lower bound, if the increase in government purchases were large enough (say three times as big as the actual stimulus package), it might push output to Y’’, as shown below, a higher level of output than the unstable equilibrium, bringing the risk-adjusted net rental rate above the -2% per year real rate at the zero lower bound, and reignite generic investment. (See below.) Note that there is critical level of government purchases that does this, and a discontinuity in the effects of government purchases at that level.     

The graph below shows a situation where efforts to bring the risk premium back down have been less successful. Here the triple-sized increase in government purchases is not enough. 

But a still bigger increase in government purchases combined with a zero nominal rate up to an even higher level of output might do the trick, as shown below.  

“Stagnation”

Of course, there is the logical possibility that the risk-adjusted net rental rate might be below -2% per year even at the natural level of output. In this situation, the zero lower bound makes it impossible to reignite generic investment (until longer-run forces intervene, such as the gradually wearing away of the generic capital stock).

How Eliminating the Zero Lower Bound Deals with Stagnation

Even the stagnation situation is compatible with getting back to the natural level of output if the zero lower bound has been eliminated. The real interest rate would be below -2% at the natural level of output, reflecting some combination of bad supply-side factors, but monetary policy would be handling those supply-side factors as gracefully as possible.