Prominent Exoplanet Researcher Found Guilty of Sexual Harassment

Unacceptable behavior by Geoff Marcy. Being a good scientist doesn’t give anyone a pass to make other people’s lives miserable in this way. 

On sexual harassment in science, also see Hope Jahren’s New York Times article “She Wanted to Do Her Research. He Wanted to Talk ‘Feelings.’” And John Johnson, in “Fed Up With Sexual Harassment: Defining the Problem” on the Women in Astronomy blog writes this:

If you are a man and struggle to see why an unwelcome sexual advance can be so disturbing, take my friend’s suggestion and ignore the gender mismatch. Instead of imagining a senior woman touching you, imagine a large, muscular man gazing seductively into your eye while touching your knee just before colloquium. How well would you remember the talk? What would be on your mind following the talk? Who would you talk to about the incident, especially if the man who has a crush on you has control over your career?

Division of Labor in Track-and-Hook Songwriting

In country music, the melody-and-lyrics method is still the standard method of writing songs. (Nashville is in some respects the Brill Building’s spiritual home.) But in mainstream pop and R&B songwriting, track-and-hook has taken over, for several reasons. For one thing, track-and-hook is more conducive to factory-style song production. Producers can create batches of tracks all at one time, and then e-mail the MP3s around to different topliners. It is common practice for a producer to send the same track to multiple topliners—in extreme cases, as many as fifty—and choose the best melody from among the submissions. Track-and-hook also allows for specialization, which makes songwriting more of an assembly-line process. Different parts of the song can be farmed out to different specialists—verse writers, hook smiths, bridge makers, lyricists—which is another precedent established by Cheiron. It’s more like writing a TV show than writing a song. A single melody is often the work of multiple writers, who add on bits as the song develops. …In a track-and-hook song, the hook comes as soon as possible. Then the song ‘vamps’—progresses in three- or four-chord patterns with little or no variation. Because it is repetitive, the vamp requires more hooks: intro, verse, pre-chorus, chorus, and outro hooks. ‘It’s not enough to have one hook anymore,’ Jay Brown explains. ‘You’ve got to have a hook in the intro, a hook in the pre, a hook in the chorus, and a hook in the bridge, too.’ The reason, he went on, is that ‘people on average give a song seven seconds on the radio before they change the channel, and you got to hook them.’
— John Seabrook, The Song Machine: Inside the Hit Factory

Dan Benjamin, Ori Heffetz and Miles Kimball—Repairing Democracy: We Can’t All Get What We Want, But Can We Avoid Getting What Most of Us *Really* Don’t Want?

The 2016 US presidential election is noteworthy for the low approval ratings of both major party candidates. For example, as of November 2, 2016, poll averages on RealClear Politics show 53.6% of respondents rating Hillary Clinton unfavorably, while only 43.9% of respondents rate her favorably; 58.9% of respondents rate Donald Trump unfavorably, while only 38.1% of respondents rate him favorably. Leaving aside those who vote for a minor party or write-in candidate, there is no question that on election day, many voters will think of what they are doing as voting against one of these two candidates rather than voting for one of them.

Out of all the many candidates who campaigned in the primaries to be President of the United States, how did the electoral system choose two who are so widely despised as the candidates for the general election? The party system for choosing the candidates for the general election may bear some of the blame, especially in an era of high political polarization. But another important characteristic of the current US electoral system is that one can only make a positive vote for a candidate, not a negative vote.  That is, in the current voting system, voters can only express one attitude towards a candidate—the belief that she or he would make the best president among the candidates. But, should this be the only attitude that comes into play when picking the most powerful person of the free world? Shouldn’t our voting system give voters a chance to say which candidate they think would make the worst president before we deposit the U.S. nuclear codes in a new president’s hands? And more generally, shouldn’t our voting system take into account how much voters like or dislike the candidates?

Our work on collective decision-making mechanisms for incorporating subjective well-being data into policy-making led us to stumble on a class of voting systems for multicandidate elections that we think might help in avoiding outcomes that a large share of people hate. For us, this research program began with “Aggregating Local Preferences to Guide Marginal Policy Adjustments” (pdf download) by Dan Benjamin, Ori Heffetz, Miles Kimball and Nichole Szembrot in the 2013 AEA Papers and Proceedings. More recently, “The Relationship Between the Normalized Gradient Addition Mechanism and Quadratic Voting” by Dan Benjamin, Ori Heffetz, Miles Kimball and Derek Lougee (on which Becky Royer worked as an extremely able research assistant) draws some connections between what we have come to call the “Normalized Gradient Addition (NGA) mechanism” and a broader literature. (Here is a link to a video of my presentation on that paper.)

Figure 1: Voting Diagram for Three Candidates

To better understand the NGA mechanism as applied to multicandidate voting, consider the simple case in which there are three candidates – Tom, Dick, and Jerry – as shown in Figure 1 above. In this case of multicandidate voting, we represent how close each candidate is to winning by a point in a triangle. The three vertices represent victory for one particular candidate, while the edges opposite a vertex represent that candidate being eliminated. The distance from each edge can be thought of as a kind of “notional probability” that a particular candidate would win if the selection process were somehow cut short and terminated in the middle of the action. Thus, the points in the interior of the triangle represent an unresolved situation in which each candidate is still treated as having a chance. Voters can choose vectors of a fixed unit length in any direction within the triangle. The current position in the triangle then gradually evolves in a direction determined by adding up all of these vector votes. 

To illustrate, In the picture on the left of Figure 1, there is a blue arrow pointing from the starting point upwards towards Dick. This is the only movement that our current voting system allows for; a positive vote for one candidate. But there is also the red arrow, pointing in the opposite direction. This corresponds to a “negative” vote, in which the voter’s only goal is to vote against Dick. Not only would our mechanism allow for both these positive and negative votes, but it would allow voters to have even more complex votes based on their specific preferences for each of the candidates, as indicated by all of the arrows in the picture on the right. This example can be extended to higher dimensions, in which there are more than three candidates. For example, the policy space would be modeled as a tetrahedron for four candidates, or a simplex for five or more candidates, with a vertex for each candidate.

Figure 2: Summing the Votes and Adjusting the Position in the Triangle

From these preference vectors, we can then add up the vectors across people to determine the direction in which the position in the triangle evolves. Figure 2 above depicts an example of a simple two-voter system. In this example, person 1’s vector points most closely towards Jerry, while person 2’s vector points most closely towards Dick. After summing these two vectors, a small number  times the resulting vector is added to the previous point in this triangle to get a new point. If that new point is outside the triangle, then the closest point on the boundary of the triangle is the new position instead. This procedure is then repeated until either a vertex is reached (decisive victory for one candidate) or all motion grinds to a halt because the votes exactly counterbalance one another. 

It is important to note that we would not need or expect all voters to understand this triangular representation of the voting mechanism. Our focus is on designing a survey that lets individuals easily provide the information needed to calculate the direction a particular voter would most like to go, without them having to know this representation of their vote explicitly.  

The voting process is a matter of giving a rating to each candidate on a scale from 0 to 100, where 0 is the rating for the least favored candidate and 100 is the rating for the most favored candidate. Giving a rating to each candidate allows a voter the options of:

  • a straight “positive” vote, by rating the most favored candidate 100 and all other candidates 0,

  • a straight “negative” vote, by rating the least favored candidate 0 and all other candidates 100,

  • anything in between a straight positive and a straight negative vote, by rating the least favored candidate 0, the most favored candidate 100 and other candidates in between.

Data Collection

In order to illustrate the process of having voters rate candidates, and investigate what type of votes people wanted to cast, we collected data on the University of Southern California’s Understanding America Study, between March 18 - 21, 2016, on preferences over the last five major party candidates standing at the time (Hillary Clinton, Ted Cruz, John Kasich, Bernie Sanders, and Donald Trump).  

We asked participants who they believed would make the best President of the United States out of the five candidates, and then asked them who would make the worst. We set their “best” candidate at a rating of 100 and their “worst” candidate at a rating of 0. We had two different approaches for having each individual rate candidates after this point. 

In our first approach, we simply asked participants to “rate the other candidates using a special scale, where [worst candidate] is a 0 and [best candidate] is a 100”, with no other instructions. Let’s refer to this approach as “unstructured ratings.”

In our second approach, we seek to elicit participants’ expected utilities for each candidate. That is, we want to identify how much each participant would value having each candidate as president compared to the other candidates. In doing so, we explained that choosing a rating X on the scale indicates that the participant feels indifferent between the following two situations: (1) knowing for sure that the candidate they are rating will be president, and (2) waking up on election day with their favorite candidate having an X% chance of winning and their most disliked candidate having a (100-X)% chance of winning. Figure 3 is a screenshot of the directions each participant received in this approach, including two examples for clarity, in which the voter had chosen Donald Trump as the “worst” candidate and Hillary Clinton as the “best” candidate.

Figure 3: Instructions for Expected-Utility Ratings

A priori we favor the expected-utility ratings over the unstructured ratings, but we will report results using the unstructured ratings for those who don’t share that view and to show that it matters what instructions were given regarding how to use the scale.  

Converting the Ratings Into Votes

In the simplest, most straightforward implementation of the NGA mechanism, we construct each individual’s vector vote from their ratings as follows:

  • Calculate the individual’s mean rating across all five candidates and the standard deviation of the individual’s ratings.

  • For each candidate, starting with the individual’s rating of that candidate, subtract the individual’s mean and divide by the individual’s standard deviation.

This procedure normalizes an individual’s candidate ratings to have mean zero and variance one. That way, the vector vote of each individual is ensured to be of length one. Although there are other strategic voting issues we will return to below, the normalization prevents anyone from having more influence than other voters simply by giving all extreme ratings (all 0’s or 100’s). We refer to this restriction—equivalent to the vector in the triangle, tetrahedron or simplex representation having a maximum length of 1–as the “variance budget.” That is, each voter has a restricted amount of variance in their normalized vector, so in effect, voters cannot express a stronger opinion about one candidate without having to express less strong opinions about other candidates. Visually, this “budget” ensures that each voter’s preference vector is of the same length in figures 1 and 2. 

The normalized ratings having a mean of zero represents something even more basic: since only one candidate will win in the end, one cannot raise the chances of one candidate without lowering the chances of at least some other candidates.

To us, there is an intuitive attraction to focusing on normalized ratings, even apart from the NGA motivation that led us to that focus. So we will use the normalized ratings extensively in our empirical analysis of the data.

Analyzing the Data

Who Would Win? The first question to ask of the data is who would have won? First, let’s see who would have won in our sample using the current voting system. We assume that participants vote for the candidate that they chose as the “best” candidate. Tables 1 and 2 show these results, broken up by unstructured and expected utility ratings. We see that in both types of ratings, Hillary Clinton outperforms the other candidates. Note that at this stage in the survey, both types of ratings ask the same question (“who would make the best candidate”), so it is expected that the results would be similar.  

Table 1: Number of “best” candidate ratings using unstructured ratings

Table 2: Number of “best” candidate ratings using expected utility ratings

From these results, we see that Hillary Clinton would be the nominated Democrat in both rating types, and Donald Trump would be the nominated Republican in our sample. Of those two remaining candidates, our sample of participants would elect Hillary Clinton, with 459 participants who prefer her, over Donald Trump, with 325 participants who prefer him.

Now, let’s look at how these results would change if we consider NGA as a multicandidate voting mechanism, as previously described. In the simplest, most straightforward implementation of NGA for a multicandidate election, the victor is the candidate with the greatest sum of normalized ratings across voters. (Note that it is possible to repeat the process of adding a small vector   based on the same information. Typically, this will lead first to a side or edge—one candidate being eliminated—and then to a vertex, one candidate being victorious.)  

As a prediction of what would happen in an actual multicandidate election using NGA, the results from our data need to be taken with a large grain of salt for at least three reasons. First, our survey was conducted months before November 8, when voters’ knowledge of the five candidates was still relatively limited—not to mention in an election cycle with lots of dramatic “October surprises.” Second, the total number of survey respondents is relatively small, and our survey respondents are not fully representative of the actual population of voters, though every effort was made to make the UAS survey as representative as possible of the adult US population overall. And third, our survey respondents knew that their answers to our survey would not determine who would become president, and so they were not subject to incentives for strategic misreporting that would arise in a real-world multicandidate election using NGA. But that makes the data even more interesting as an indication of which candidate would have been most acceptable to a wide range of voters. Here are averages of the normalized ratings for both the sample that was asked to give unstructured ratings and the sample that was asked to give expected-utility ratings:

Table 3: NGA Results Using Unstructured Ratings

Table 4: NGA Results Using Expected Utility Ratings

Thus, leaving aside any effects from strategic voting (and ignoring for the moment the timing of our survey and the non-representativeness of our sample), our data point to John Kasich as most likely to have won the election using NGA to resolve the multicandidate choice over all of these five candidates. While his mediocre performance under our current voting system suggests that he was not the favorite candidate of all that many voters, our respondents overall found him relatively acceptable.  

Bernie Sanders has the second-to-highest average rating, despite not performing very well in the primary. Donald Trump has the lowest average rating by far, with Ted Cruz second-to-lowest using the unstructured ratings and Hillary Clinton second-to-lowest using the expected-utility ratings. The most interesting point to take away is that, by the expected utility ratings, out of these five candidates, the current general election has come down to the two candidates with the lowest average ratings. (This is in line with the low approval ratings for both Donald Trump and Hillary Clinton.)

Expected-Utility Ratings vs. Unstructured Ratings. A striking difference between the expected utility ratings and the unstructured ratings is the greater prevalence of tendencies toward lower normalized ratings with the expected utility ratings.

One way to illustrate this difference is to look at scatterplots of the most extreme rating (in absolute value) in the normalized ratings vs. the second most extreme rating in the normalized ratings. In figures 4 and 5 below, we can see whether participants’ most extreme preferences were for a certain candidate (indicated by points with a positive x value) or against a certain candidate (indicated by points with a negative x value).  

Figure 4: Most Extreme vs. Second Most Extreme Ratings Using Unstructured Ratings

tumblr_inline_og19d2fP9I1r57lmx_400.png

Figure 5: Most Extreme vs. Second Most Extreme Ratings Using Expected Utility Ratings

Out of the expected-utility vector votes, 345 have the most extreme normalized rating negative, compared to 133 that have the most extreme normalized rating positive. By contrast, out of the unstructured vector votes, 211 have the most extreme normalized rating positive, compared to 120 that have the most extreme normalized rating negative. This trend suggests that participants emphasize their negative feelings toward candidates more in the expected utility ratings as compared to in the unstructured ratings.

This stark contrast between the expected utility ratings and the unstructured ratings can further be seen through the notable differences in the shape of the distribution between these two types of ratings. Skewness describes respondents’ tendencies to rate some candidates much higher than average (skewness > 0) in comparison to the standard deviation of 1 or much lower than average (skewness < 0). Intuitively, a set of ratings with a positive skewness is somewhat closer to being a “positive” vote, while a set of ratings with a negative skewness is somewhat closer to being a “negative vote.” Figure 6 shows that in the unstructured ratings, skewness tends to be more positive than in the expected utility ratings. Table 5 gives summary statistics corresponding to this graph. This indicates that respondents are closer to casting “positive” votes in the unstructured ratings. The expected utility ratings, on the other hand, tend to have a more negative skew, and are thus closer to being “negative” votes. Table 5 emphasizes this point, by showing that the average skew for unstructured ratings is indeed positive, while the average skew for the expected utility ratings is strongly negative.

Figure 6: Skewness of Unstructured vs. Expected Utility Ratings

Table 5: Skewness of Ratings

Thus, by both this measure of skewness and by the extreme ratings plots, the expected-utility ratings look closer to being negative votes (votes against a candidate) while the unstructured ratings look closer to being positive votes (votes for a candidate).

Why Are the Expected-Utility Ratings So Different from the Unstructured Ratings? A solid answer to the question of why the expected-utility ratings are so different from the unstructured ratings (and the related question of whether our a priori preference for the expected-utility ratings is justified empirically) would require additional data in another multicandidate election. But we are able to provide one hypothesis. Because our data were collected in the heat of the primaries, our respondents may have wanted to use the ratings to express their opinions about those primary battles, using a substantial portion of the 0 to 100 scale to express those opinions, and consequently squeezing down the amount of the scale left to express their opinions about the candidates in the party they favored less. The structure of expected-utility ratings would have pushed back against this tendency, asking the respondents, in effect, “Are you really willing to accept a substantial chance of your least favorite candidate winning in order to get your favorite candidate instead of your second- or third-choice?”

To see if this hypothesis is at all consistent with the data, consider the variance among an individual’s two or three ratings within the party of that individual’s favorite candidate. Tables 6 and 7 show that the within-party, within-voter variance is substantially greater for the unstructured ratings than for the expected utility ratings. This lends some support to the idea that those answering the unstructured ratings were more focused on the primaries, overstating their dislike for the “other” candidate(s) in the party, whereas in the expected utility ratings, participants were more likely to think about the general election and save more of the unit variance in normalized ratings for candidates in the other party.

Table 6: Among those whose top candidate was a Democrat, what was the average variance between Clinton and Sanders ratings?

Table 7: Among those whose top candidate was a Republican, what was the average variance between Cruz, Kasich, and Trump ratings?

Multiple-Stage NGA Voting.

In the current voting system, strategic voting for someone other than one’s most preferred choice is a commonplace. So there is no reason to dismiss a new voting system for having some degree of strategic misreporting. But to allow voters the simplicity of truthful reporting in their ratings without hurting themselves too much, we view it as desirable to have the incentives for strategic misreporting be relatively small. Given the issues taken care of by the normalization of the ratings, the incentive for strategic misreporting we have worried most about is the incentive to avoid giving a strong negative rating to a candidate who is going to be eliminated anyway, since doing so would dilute the ratings assigned to other candidates. That is, there is an incentive to free ride on the elimination of widely disliked candidates. Fortunately, modifications of the NGA mechanism can help reduce this incentive or help insure reasonable results despite some degree of strategic voting.

One modification of the NGA mechanism helpful in dealing with free riding in the elimination of widely disliked candidates is to vote in stages. Rather than taking ratings at one point in time to guide movement all the way to a vertex with one candidate winning, one can have a series of nonpartisan “open primaries” in which the notional probabilities of a candidate winning if things were ended prematurely are adjusted some distance, but not all the way to one candidate winning. This gives voters a chance to see if a candidate many thought would be quickly eliminated is doing well, making it worthwhile spending some of one’s variance budget voting against them in the next stage. On the other hand, taking the ending point of the adjustments in notional probabilities from the nonpartisan open primary as the starting point for the next stage ensures that all voters have some reward for the voting efforts they make, even in the first stage. 

Having multiple stages also serves other purposes. There could easily be candidates in an initially crowded field that voters simply don’t know much about and don’t want to invest in learning about because it seems those candidates have no chance. A nonpartisan open primary helps voters and journalists know which candidates are worth learning more about.

(Also, one practical issue with the early “primaries” is the large number of candidates a voter might be asked to rate. One way to handle this is to include an option for casting a straight positive or straight negative vote that effectively fills in 0’s and 100’s for all the candidates accordingly.) 

A Smoothed-Instant-Runoff Version of NGA for Multicandidate Elections

The NGA perspective from which we are looking at things suggests another, more technical way to reduce the incentive for strategic misreporting: using exactly the same kind of survey to elicit expected-utility ratings, but modifying the mechanism so that it automatically deemphasizes the ratings of candidates who are on their way out. This involves (a) demeaning using a weighted average that gives a low weight to candidates that have a currently low notional probability of winning, (b) slowing down (without stopping) the adjustment of notional probabilities that are already low, and (c ) steering vector votes toward focusing on candidates that still have a relatively high notional probability. There is a parameter that determines whether these three things happen only when the notional probability of a candidate is very low or more gradually. If these modifications happen only when the notional probability of a candidate is very low, the mechanism becomes a combination of the simplest implementation of NGA and the idea behind instant-runoff voting, where voters re-optimize once a candidate is eliminated. With less extreme values of the parameter, the spirit of instant-runoff voting is smoothed out. Regardless of that parameter, the basic NGA idea is preserved. 

A downside of the smoothed-instant-runoff version of NGA for multicandidate elections is its complexity. It would still be fully verifiable, but those who do not fully understand it might be suspicious of it. Nevertheless, to the extent it makes one aspect of strategic voting happen automatically without strategic misreporting, it would put less sophisticated voters more on a par with the more sophisticated voters. 

Incentives for Politicians

A great deal of research is needed to fully understand incentives for politicians under an NGA or Smoothed-Instant-Runoff NGA multicandidate voting system with multiple stages. However, we are willing to make some conjectures. If people view certain important candidates of an opposing party as “the devil,” the strong negative ratings for those “diabolical” candidates would open up an opportunity for centrist candidates like John Kasich whom few voters see as “diabolical.” It could even open up space for new centrist parties. 

Undoubtedly there are other effects that are harder to foresee, but a system that allows people to express strong negative views about a candidate should help avoid many possible bad outcomes. And the NGA system still allows people to express strong positive views about a candidate if they so choose. 

NOTE: Please consider this post the equivalent of a very-early-stage working paper. We would love to get comments. And just as for any other early-stage working paper, we reserve the right to copy wholesale any of the text above into more final versions of the paper. Because it is also a blog post, feel free to cite and quote. We want to thank Becky Royer for outstanding research and editorial assistance.

From Charters of Liberty Granted by Power to Charters of Power Granted by Liberty

IN 1792, in a short essay called ‘Charters,’ James Madison succinctly explained what he thought was the essential difference between the United States Constitution and the constitutions of every other nation in history. ‘In Europe,’ he wrote, ‘charters of liberty have been granted by power. America has set the example … of charters of power granted by liberty. This revolution in the practice of the world may, with an honest praise, be pronounced the most triumphant epoch of its history.’ The ‘charters of liberty … granted by power’ that Madison had in mind were the celebrated documents of freedom that kings and parliaments had issued throughout the ages, many still honored today: Magna Carta of 1215, the English Petition of Right of 1628, the English Bill of Rights of 1689. Documents like these had made the British constitution – unwritten though it was – the freest in the world prior to the American Revolution. A British subject enjoyed more room to express his opinions, more liberty to do as he liked with his property, more security against government intrusion, and greater religious toleration than the subject of any other monarchy in the known world. Yet for Madison and his contemporaries, that was not enough. He and his fellow patriots considered “charters of liberty … granted by power” a poor substitute for actual freedom because however noble their words, such charters were still nothing more than pledges by those in power not to invade a subject’s freedom. And because those pledges were ‘granted by power,’ they could also be revoked by the same power. If freedom was only a privilege the king gave subjects out of his own magnanimity, then freedom could also be taken away whenever the king saw fit.
— Timothy Sandefeur, The Permission Society: How the Ruling Class Turns Our Freedoms into Privileges and What We Can Do About It

Henry George: Morality is the Heart of Economics

Political economy is the simplest of the sciences. It is but the intellectual recognition, as related to social life, of laws which in their moral aspect men instinctively recognize, and which are embodied in the simple teachings of him whom the common people heard gladly. But, like Christianity, political economy has been warped by institutions which, denying the equality and brother-hood of man, have enlisted authority, silenced objection, and ingrained themselves in custom and habit of thought.
— Henry George, Protection or Free Trade.

Sun Balcony

deejayforte:

↟ “Imagination will often carry us to worlds that never were, but without it we go nowhere.” — Carl Sagan; astrophysicist, awesomist.

My favorite place in NYC is of course, The Rose Center for Earth and Space. In the center of this building is an object called the “Hayden Sphere” which serves as the museum’s planetarium and Sun (Sol) replica. I always imagined what this object would look like as an actual star—in the center of everything, which inspired this Cinemagraph.  

Instagram version

(Source: @deejayforte)

Sun Balcony

I love this picture. To me it looks like the observation deck from a hotel orbiting close to the Sun. – Miles

The Political Perils of Not Using Deep Negative Rates When Called For

Link to Jon Hilsenrath’s Wall Street Journal special report, updated August 26, 2016, “Years of Fed Missteps Fueled Disillusion With the Economy and Washington”

How well has what you have been doing been working for you?

People are quick to think that the political costs of deep negative rates to a central bank are substantial. But it is worth considering the political costs of not doing deep negative rates when the economic situation calls for it. Take as a case in point the failure of the Fed to do deep negative rates in 2009. Regardless of the reason for the Fed’s not doing deep negative rates in 2009, it is possible to see the consequences for the Fed’s popularity of the depth of the Great Recession and the slowness of the recovery. 

In his Wall Street Journal special report “Years of Fed Missteps Fueled Disillusion With the Economy and Washington,” Jon Hilsenrath tells the story of the Fed’s decline in popularity, and presents the following graphic: 

How Americans rate federal agencies

Share of respondents who said each agency was doing either a ‘good’ or ‘excellent’ job, for the eight agencies for which consistent numbers were available

The Alternative

There is no question that the Fed’s failure to foresee the financial crisis and its role in the bailouts contributed to its decline in popularity. But consider the popularity of the Fed by 2014 in two alternative scenarios: 

Scenario 1: The actual path of history in which the economy was anemic, leading to a zero rate policy through the end of 2014.

Scenario 2: An alternate history in which a vigorous negative interest rate policy met a firestorm of protest in 2009, but in which the economy recovered quickly and was on a strong footing by early 2010, allowing rates to rise back to 1% by the end of 2010 and to 2% in 2011.   

In Scenario 2, the deep negative rates in 2009 would have seemed like old news even by the time of the presidential election in 2012, let alone in 2014. In the actual history, Scenario 1, low rates are still an issue during the 2016 presidential campaign, because the recovery has been so slow. 

It Looks Good to Get the Job Done

At the end of my paper “Negative Interest Rate Policy as Conventional Monetary Policy” (ungated pdf download) published in the National Institute Economic Review, I discuss the politics of deep negative interest rates–not just for the United States, but also for other currency regions that needed them. My eighth and final point there is this:

Finally, the benefits of economic stabilisation should be emphasised. The Great Recession was no picnic. Deep negative interest rates throughout 2009 – somewhere in the –4 per cent to –7 per cent range – could have brought robust recovery by early to mid 2010. The output gaps the world suffered in later years were all part of the cost of the zero lower bound. These output gaps not only had large direct costs, they also distracted policymakers from attending to other important issues. For example, the later part of the Great Recession that could have been avoided by negative interest rate policy led to a relatively sterile debate in Europe between fiscal stimulus and austerity, with supply-side reform getting relatively little attention. And the later part of the Great Recession that could have been avoided by negative interest rate policy brought down many governments for whom thepolitical benefits of negative interest rate policy would have been immense. And for central banks, it looks good to get the job done.

Dan Bobkoff and Akin Oyedele: Economists Never Imagined Negative Interest Rates Would Reach the Real World--Now They’re Rewriting Textbooks

Link to Dan Bobkoff’s and Akin Oyedele’s October 23, 2016 Business Insider article “Economists never imagined negative interest rates — now they’re rewriting textbooks”

An October 23, 2016 Business Insider article emphasizes just how far negative interest rate policy has come in the last four years since I published “How Subordinating Paper Currency to Electronic Money Can End Recessions and End Inflation” (originally titled “How paper currency is holding the US recovery back”) and started following negative interest rate discussions closely. 

One of the big advances in fostering understanding of negative interest rate policy is the publication of Ken Rogoff’s book The Curse of Cash, which has a thorough discussion of the full-bore negative interest rate policy I distinguished from current negative interest rate policy in “If a Central Bank Cuts All of Its Interest Rates, Including the Paper Currency Interest Rate, Negative Interest Rates are a Much Fiercer Animal.” (See my post “Ana Swanson Interviews Ken Rogoff about The Curse of Cash for more about the book.) Ken has been on the hustings promoting his book, and in the process greatly raising journalists’ and their readers’ understanding of negative interest rate policy. This article has some audio of Ken explaining negative interest rates. 

Here is what Dan Bobkoff and Akin Oyedele write about the remarkable progress of negative interest rate practice:

The policy has evolved from radical idea to mainstream policy of postrecession governments in Europe and Asia. And in the US, Federal Reserve Board Chair Janet Yellen has said the US will not rule out using them if it needs to. …

In textbooks like Mishkin’s, a 0% interest rate was known as the “zero lower bound.” It just didn’t seem to make sense to go below that.

Now economists have to rename it. …

Today, countries with negative policy rates make up almost a quarter of global gross domestic product, according to the World Bank.

One element of Dan’s and Akin’s article deserves further discussion. They touch on the difficulty of passing through negative rates to household depositors:

“It’s very hard to obviously get depositors to accept negative interest rates for putting their money in there,” said Marc Bushallow, managing director of fixed income at Manning and Napier, which manages $35 billion in assets.

What’s much more likely is that only big banks will be forced to pay to lend money to one another. That would exempt small depositors from paying, but still have some of the stimulus effects that the central banks intend to have.

Something I emphasize in my talks to central banks is that a central bank is better off letting private banks handle much of the pass-through because the negative in regular people’s deposit and savings accounts that are likely to be a political problem a central bank represent a customer-relations problem for private banks that the private banks are likely to handle relatively carefully.

I think of negative deposit rates for small household checking and savings accounts as a big enough political problem for central banks that I have been strongly recommending to central banks that they use a tiered interest-on- reserves formula that actively subsidizes zero rates for small household checking and savings accounts. If a central bank can announce that it is trying to avoid having regular people with modest balances face negative rates in their checking or savings account, it should dramatically mitigate the political costs to a central bank of a vigorous negative interest rate policy. 

I have written about subsidizing zero rates for small household accounts in a number of posts:

Courage on the part of central bankers plus smart efforts to mitigate the political costs of a vigorous negative rate policy can do a great deal to advance negative interest rate policy as an element of the monetary policy toolkit. Nations that have such courageous and shrewd central bankers can then return to the Great Moderation, while maintaining low inflation targets. 

On Consent Beginning from a Free and Equal Condition

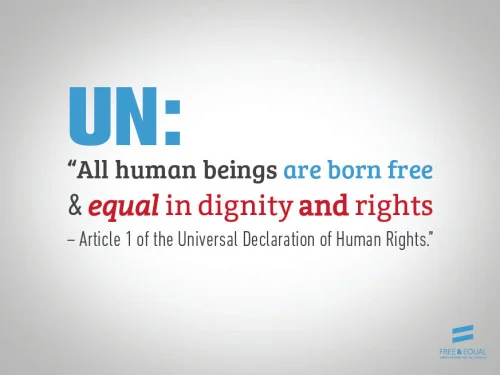
The assertion in Article 1 of the Universal Declaration of Human Rights that “All human beings are born free and equal in dignity and rights” still sounds radical when applied to undocumented immigrants and members of small sexual minorities. To back up this assertion, it is hard to do better than John Locke in section 4 of his 2d Treatise on Government: “On Civil Government”:

To understand political power right, and derive it from its original, we must consider, what state all men are naturally in, and that is, a state of perfect freedom to order their actions, and dispose of their possessions and persons, as they think fit, within the bounds of the law of nature, without asking leave, or depending upon the will of any other man.

A state also of equality, wherein all the power and jurisdiction is reciprocal, no one having more than another; there being nothing more evident, than that creatures of the same species and rank, promiscuously born to all the same advantages of nature, and the use of the same faculties, should also be equal one amongst another without subordination or subjection, unless the lord and master of them all should, by any manifest declaration of his will, set one above another, and confer on him, by an evident and clear appointment, an undoubted right to dominion and sovereignty.

When I read this, I see an image of two human beings meeting in the middle of a trackless wilderness. They may have come from civilized territories, but that is all far away. One might be bigger and stronger than the other, and so able to take advantage of the other, but there is no good and just reason why one should rule over the other. They both deserve to be free and equal in relation to each other.

Writing when he did, it is not surprising that John Locke refers to God, but he suggests a very high burden of proof if someone claims that God has put one human being above another.

John Locke’s picture of people starting out free and equal, without any hierarchy, as we typically think of our literal neighbors next door, is very powerful. Thinking about the morality that applies between neighbors from this angle has generated some of the most persuasive Libertarian writing. I am thinking particular of Michael Huemer’s book The Problem of Political Authority: An Examination of the Right to Coerce and the Duty to Obey. My reading of that book generated several posts:

I have thought that the starting point of being free and equal doesn’t absolutely have to point to a minimalist state. In particular, if someone would freely choose to belong to a state rather than stay in a separate, free and equal condition, then the state may be just. But there are some important considerations.

First, human beings are social creatures. It is not fair to imagine someone’s “free and equal” alternative as being alone. Rather, imagine the “free and equal” alternative as being in a highly social group of a few friends and family. Unless a state is better than that, it is not just.

Second while the provision of the basic justice of safety and protection from violence may be enough to justify the requiring a contribution to the resources necessary to provide that safety and protection if the individual would choose that protection over the state of nature even at the cost of the taxation, it seems unfair to use the surplus from the provision of protection at that cost to justify a government that goes beyond that protection. That is, think of two steps: a government that provide basic physical protection and justice at some cost. This is just getting people up to their basic rights–at a cost that someone has to bear. Then a government that goes beyond that had better provide surplus from the things that go beyond the basic provision of justice.

Let me give an example. A government might provide a commercial code and roads to make it easier to carry on commerce. If someone who doesn’t have to worry about basic security because of the minimal justice activities of a state, who was allowed to stop with those basic security benefits would still choose to join a state with that state that provided a commercial code and roads to make it easier to carry on commerce, then such a state providing infrastructure and a commercial code as well as basic physical safety might be just.  

Some of these functions–such as roads–might be provided by private parties rather than by the state, but in this way of thinking about things, the state is viewed as if it were a species of private organization. As long as the people subject to it would voluntarily choose to belong to it, even when they still had basic physical security when not belonging, then the demands of the state can be seen as like those of a private club. 

Looking at things this way, a basic right has to always be to leave the club if one wants to. And one should be able to continue to associate easily with others who have decided to leave the club, and even form an alternative club. Thus, from this point of view, for existing states to be just, it is crucial that there be spots on the earth where people can buy land along with the associated political rights to start a new nation on that land

If one wants to justify redistributive taxation, there is a twist one can put on this notion that free and equal individuals would have to voluntarily want to belong to a state for that state to be just. That is to change the question to whether someone would voluntarily choose to belong to a state over remaining free and equal with all others outside a state behind a Rawlsian veil of ignorance, not knowing if one would be talented or not and therefore not knowing if one was likely to be rich or poor. I think John Locke himself was more in the spirit of asking whether one would agree after knowing one’s level of talent to belong to a society. But would-be willingness to consent if one were behind a Rawlsian veil of ignorance might count for something in the justice of a state existing. 

Thinking of consent to belong to a state as compared to a free and equal state of nature, there is one very tough minimal requirement of justice that is not always noted: a state must not be dominated in attractiveness by another state that is willing to accept more members. And if State B is more attractive than State A for reasons that State A could imitate that calls into serious question the justice of State A as it is. Further, even if State B in this story doesn’t actually exist, but truly could exist in all practicality, much of the force of the argument remains. 

That is, the logic of consent from the free and equal state of nature means this: a state is unjust if it is doing things in a suboptimal way that people would migrate away from to a more optimized state. The reason is that no one would consent to be part of the state doing things in a suboptimal way if they could instead be part of the state doing things the optimal way. In other words, bad public policy that is bad enough people would want to migrate away from it is not just bad, it is unjust. 

One can combine this idea of a suboptimal policy being unjust because no one would consent to it if starting in a free and equal condition they could choose a similar state but with a better policy with the idea of consent from behind a Rawlsian veil of ignorance. If one would shift one’s decision of which state to be a part of from one with a policy that looks less attractive behind the veil of ignorance to one that looks more attractive behind the veil of ignorance, the justice of a state with a policy that would look less attractive behind the veil of ignorance stands in question. 

John Locke’s perspective of people beginning free and equal is very refreshing in a world still filled with domineering states. The world still has a long way to go on the way to freedom.

Nate Cohn: How One 19-Year-Old Illinois Man is Distorting National Polling Averages

The link above is to a well-done New York Times article analyzing the results highlighted on the website for the USC Daybreak Poll that has made things look so much more favorable for Donald Trump than other polls.  

Let me emphasize that the underlying data for the Daybreak poll are extremely valuable. Having a panel makes it possible to answer many questions that cannot be answered well with a repeated cross-section. The problem is with the calculation for the highlighted comparison between Donald Trump and Hillary Clinton support. 

The most important problem with the graph highlighted on the Daybreak Poll website is the weighting by the candidate a poll respondent claimed to have voted for in the last election. Nate Cohn is good at talking about the biases that introduces because people underreport voting for the loser. Thus, forcing the weights to make the reports of who people voted for equal to the actual shifts the weights too much toward the sort of people who might have actually voted for the loser. Many self-reported “Obama” or minor-candidate voters were really Romney voters. People who admitted voting for Romney are more Republican than the overall set of people who actually voted for Romney. So inflating the weights of people who reported voting for loser Romney up to equal the fraction of those who actually voted for Romney makes things look more favorable for Trump than they should be. 

To me, the main way the data on voting in the last election should be used is in correcting for each demographic group the difference between the percent chance they said they would vote and whether they actually voted or not. It is not clear that this needs to use the self-reported voting after the fact at all; exit polls should provide good evidence on actual voting percentages by demographic group that can be compared to the probabilities people said in advance in each demographic group in this kind of data collection in 2012 (which I know was done on RAND’s American Life Panel in 2012).  

Why Central Banks Can Afford to Subsidize the Provision of Zero Rates to Small Household Checking and Savings Accounts

The Bank of Thailand, which currently has a policy rate of only 1.5%, and so might need negative rates if there is a big shock to the Thai economy.&nbsp;Image source.

The Bank of Thailand, which currently has a policy rate of only 1.5%, and so might need negative rates if there is a big shock to the Thai economy. Image source.

One of my key recommendations to central banks to reduce the political costs of a vigorous negative rate policy is to use the interest on reserves formula to subsidize the provision of zero interest rates to small household checking and savings accounts, as you can see in my posts “How to Handle Worries about the Effect of Negative Interest Rates on Bank Profits with Two-Tiered Interest-on-Reserves Policies” and “Ben Bernanke: Negative Interest Rates are Better than a Higher Inflation Target” and “The Bank of Japan Renews Its Commitment to Do Whatever it Takes.” (Also see “How Negative Interest Rates Prevail in Market Equilibrium” for a discussion of how the marginal rates that matter most for market equilibrium can be negative even if many inframarginal rates are zero.) 

If rates become quite negative, this subsidy could become a significant cost to the central bank, since funds from private banks put into one tier of reserves would be getting a zero rate from the central bank, but after putting those funds into T-bills, the central bank could be earning a deep negative rate on those funds, say -4%. Nevertheless, I think central banks can handle the expense. This post explains why. (Talking to other economists at the Minneapolis Fed’s Monetary Policy Implementation in the Long Run Conference yesterday helped a lot in figuring this out.)

First, the transition to negative rates will create a large capital gain for the assets on the central bank’s balance sheet, while most of the central bank’s liabilities are shorter term or floating-rate liabilities and so do not go up as much in price. This includes paper currency as a liability, since in an electronic money policy that allows deep negative rates, the paper currency interest rate is a policy variable set equal to a rate close to the target rate. (See “How and Why to Eliminate the Zero Lower Bound: A Reader’s Guide.”)

Second, the fact that the central bank can create money means that it cannot face a liquidity constraint as long as it is ultimately solvent. And the ultimate solvency of a central bank must be judged in the light of all future seignorage the central bank is likely to earn, ever, even if that ability to earn future seignorage is not represented by any asset that can be immediately sold.

As long as the central bank is trying to stimulate the economy, there is no problem with it creating additional money to pay all of its bills, including to pay its losses on its holdings of negative-rate Treasury bills. When it is time to tighten, any central bank that can pay interest on reserves doesn’t have to have an asset to sell in order to tighten monetary policy. Interest on reserves can be paid by newly created reserves using a central bank’s fundamental authority to create money. As long as there will be seignorage someday sufficient to mop up those extra reserves, this is a perfectly good way to tighten monetary policy.

Third, what matters for the sustainability of paying positive interest on reserves once it is time to tighten is the amount of seignorage the central bank could earn if it needed to. In an emergency, an electronic money policy allows for the possibility of seignorage from paper currency interest rates below the target rate, say by as much as 5% below.

Fourth, the markets will expect that the central bank is ultimately backed by the fiscal authority. Note that because it faces no liquidity constraints, the central bank can always wait and wait and wait for a very propitious time to beg the fiscal authority for an infusion of funds. And the markets know this. So the solvency of the central bank depends on the willingness of an exceptionally favorable fiscal authority at some future date to give it an infusion of funds. (To that exceptionally favorable fiscal authority, the central bank can argue that the deep negative rates that cost it a lot in subsidies saved the fiscal authority a lot of interest expense.)

Fifth, given whatever large present value of subsidies to support zero rates to small household borrowers a central bank has the resources for, the central bank can afford to front-load the subsidies. Deep negative rates will probably be needed only for a short time, and if necessary, an announcement that without help from the fiscal authority the cap on the amount subsidized for a zero rate in checking and savings accounts will have to be gradually reduced will probably get some help from the fiscal authority, and if not can actually be carried out.

The bottom line is that a central bank is unlikely to get into serious budget trouble from subsidizing zero rates for small household accounts even if it takes rates to a quite deep negative level.

The Transformation of Songwriting: From Melody-and-Lyrics to Track-and-Hook

By the mid-2000s the track-and-hook approach to songwriting—in which a track maker/producer, who is responsible for the beats, the chord progression, and the instrumentation, collaborates with a hook writer/topliner, who writes the melodies—had become the standard method by which popular songs are written. The method was invented by reggae producers in Jamaica, who made one “riddim” (rhythm) track and invited ten or more aspiring singers to record a song over it. From Jamaica the technique spread to New York and was employed in early hip-hop. The Swedes at Cheiron industrialized it. Today, track-and-hook has become the pillar and post of popular song. It has largely replaced the melody-and-lyrics approach to songwriting that was the working method in the Brill Building and Tin Pan Alley eras, wherein one writer sits at the piano, trying chords and singing possible melodies, while the other sketches the story and the rhymes.
— John Seabrook, The Song Machine: Inside the Hit Factory