The Religious Dimension of the Lockean Law of Nature
The desire for equality has been used to justify quite heavy-handed action by states. But John Locke, in his 2d Treatise on Government: “On Civil Government” section 6, reasons from the equality of all to natural rights. To John Locke, equality means a starting place in which no one is under the thumb of anyone else, and those who are not under the thumb of anyone else are free. In John Locke’s view, beyond a prohibition on suicide reflecting his view of our relationship to God, the key bound on that freedom is that one is not allowed to “take away, or impair … the life, the liberty, health, limb or goods of another”:
But though this be a state of liberty, yet it is not a state of license: though man in that state have an uncontroulable liberty to dispose of his person or possessions, yet he has not liberty to destroy himself, or so much as any creature in his possession, but where some nobler use than its bare preservation calls for it. The state of nature has a law of nature to govern it, which obliges every one: and reason, which is that law, teaches all mankind, who will but consult it, that being all equal and independent, no one ought to harm another in his life, health, liberty, or possessions: for men being all the workmanship of one omnipotent, and infinitely wise maker; all the servants of one sovereign master, sent into the world by his order, and about his business; they are his property, whose workmanship they are, made to last during his, not one another’s pleasure: and being furnished with like faculties, sharing all in one community of nature, there cannot be supposed any such subordination among us, that may authorize us to destroy one another, as if we were made for one another’s uses, as the inferior ranks of creatures are for ours. Every one, as he is bound to preserve himself, and not to quit his station wilfully, so by the like reason, when his own preservation comes not in competition, ought he, as much as he can, to preserve the rest of mankind, and may not, unless it be to do justice on an offender, take away, or impair the life, or what tends to the preservation of the life, the liberty, health, limb, or goods of another.
Other “natural law” doctrines view people’s freedom as limited by more than just a ban on suicide and not harming others (who are not themselves offenders). Why is it that John Locke views our freedom as so extensive? There is a clue in saying that each of us is sent into the world by God and “about his business.” In effect, John Locke views us each as the one in the best position on Earth to make the ultimate judgement for what God wants each of us to do. Although, presumably, people sometimes fail to do what God sent them to Earth to do, many beautiful things that God did send someone to do might not happen if that person’s freedom of action is blocked.
From a less theistic perspective, the point is that if someone is given freedom, they may do something wonderful that no one else would have thought to have them do. Giving each individual a chance to do that something wonderful that perhaps no one else would have thought of is figuratively giving that individual a chance to fulfill her or his mission in life.
The view that John Locke scorns is the idea that “we were made for one another’s uses.” We were made for greater ends than that. And the final judgment on those greater ends cannot be made by another.
Timothy Sandefeur: The Presumption of Freedom
“If a judge put the burden of proof on the defendant to show that he did not commit the crime, the judge would be loading the dice against him. Even if the defendant proved he did not own the gun used to commit the murder, well, perhaps he borrowed it! To disprove that, he must now prove that he did not know the gun’s owner. But perhaps he paid that person to lie! – and so forth, infinitely. Every disproof only creates a new speculation, which must again be disproved. These speculations might seem silly, but they are not logically impossible, and requiring the defendant to prove his innocence – imposing the Devil’s proof on him – would require him to disprove even such bizarre conjectures. Every accused person would find himself in a hall of mirrors, forced to prove himself innocent of an endless series of baseless accusations, without regard for the rules of logic. As a procedural matter, presuming innocence is preferable, because an erroneous conviction is harder to fix than an erroneous finding of innocence. And as a substantive matter, the presumption of innocence is better because a wrongfully convicted person suffers a different, more personal harm than the public experiences if a guilty person goes free. Likewise, there are an indefinite number of speculative reasons that might defeat anyone trying to prove that he should not be deprived of freedom, just as there are an infinite number of ‘what ifs’ that the ‘Devil’ could use against a defendant who tries to prove he did not commit a crime, or a person who tries to disprove the existence of an invisible teapot: What if a person abuses his liberty? What if he doesn’t know how to use it wisely? What if he turns out to be a psychopath – or perhaps his children or grandchildren turn out to be psychopaths? What if there are top-secret reasons of state that warrant imprisoning him – reasons no judge may be allowed to see? Wary of the Devil’s proof, logicians place the burden on the person who asserts a claim, because that is the only logically coherent way to think. Likewise, the presumption of freedom requires those who would take away our liberty to justify doing so, because that is the only logically workable way to think about politics and law.”
Next Generation Monetary Policy: The Video
Starting at the 20:30 mark in this Mercatus Center video is my presentation “Next Generation Monetary Policy.” Here is a link to the Powerpoint file for the slides I used.
This was at a September 7, 2016 Mercatus Center conference on “Monetary Rules in a Post-Crisis World.” You can see the other sessions here. (Note the 1/5 in the upper left corner of the video. Click on that to access session 1 of 5, 2 of 5, etc.)
Timothy Sandefeur: The Terrain Is Easier to Judge in the Neighborhood of Liberty Than in the Neighborhood of Unfreedom
“As a matter of procedure, starting with a presumption in favor of freedom is preferable because each step people take away from a state of liberty can be justified in theory by measuring whether they are better off. When two people sign a contract, they bind themselves, and in that sense are less free. But they consider themselves better off, and that is good enough, as long as they harm nobody else. It is not so easy to justify the reverse – a movement from a state of total unfreedom to one that is freer – because each step affects far more people. The totalitarian state is frozen solid, so that every action inflicts consequences on everyone else, and the slightest deviation from rigid order must therefore receive the approval of everyone affected. This means it is not always possible to determine whether people are better off at each step when they move in that direction. This, writes Epstein, ‘is why the restoration of even modest elements of a market system seem to pose such radical problems for Eastern European and Third World nations.’”
18 Misconceptions about Eliminating the Zero Lower Bound (or Any Lower Bound on Interest Rates): The Video
My hosts at Chulalongkorn University in Bangkok were good enough to videotape my talk there and post the video on YouTube, as I encouraged them to do. In addition to being the only complete video so far of the presentation “18 Misconceptions about Eliminating the Zero Lower Bound,” (which is my main presentation at central banks on my Fall 2016 tour of European central banks as well), there is some excellent Q&A at the end of this video.
Timothy Sandefeur: We Must Start by Presuming either in Favor of Freedom or against It
“In discussing politics, there are two possible candidates for an initial presumption. We might presume in favor of totalitarianism – everything is controlled by the government, and citizens must justify any desire to be free – or we can presume in favor of liberty and require anyone who proposes to restrict freedom to justify that restriction. Either everything is allowed that is not forbidden, or everything is forbidden that is not allowed. As Professor Richard Epstein observes, there is no third, middle-ground option, because there is no obvious midpoint between the two extremes: people will bicker endlessly about what qualifies as exactly halfway. So we must start by presuming either in favor of freedom or against it.”
Jon Birger: What 2 Religions Tell Us About the Modern Dating Crisis →
This is a fascinating article about how the interaction of demographics, including gender differentials in rates of leaving a religion, and customs about relative marriage ages, can create severe difficulties in finding a mate for those within a religion on one side of the gender divide. The article discusses the dating and marriage situation in Mormonism and Orthodox Judaism, including a discussion of both Hasidic and Yeshivish Judaism.
Timothy Sandefeur: Government Does Not Give People Rights; They Already Have Them
“Even after the Revolution, the founders were so skeptical of paper pledges of rights that the Constitution’s authors initially demurred when Americans demanded that it be amended to include a Bill of Rights. In their view, such ‘parchment barriers’ typically proved useless in times of crisis, because those in power could so easily revoke them, ignore them, or argue them away. Better to focus instead on designing a government that would include checks and balances and other structural protections to prevent the government from acting tyrannically. Even when they agreed to add a Bill of Rights, they remained convinced that freedom could never be secured solely through written promises. To them, freedom was not a privilege the state provides but a birthright the state must protect. George Mason put this point succinctly in June 1776, when he wrote in the Virginia Declaration of Rights that ‘all men are by nature equally free and independent and have certain inherent rights,’ which include ‘the enjoyment of life and liberty, with the means of acquiring and possessing property, and pursuing and obtaining happiness and safety.’ Government does not give people these rights – people already have them, and the people ‘cannot, by any compact, deprive or divest their posterity’ of these rights. Thomas Jefferson would make the point even more concisely a month later, when he wrote in the Declaration of Independence that ‘all men are created equal’ and are ‘endowed’ with ‘inalienable rights,’ which include ‘life, liberty, and the pursuit of happiness.’ Government exists ‘to secure these rights,’ not to grant them, and if it turns instead to destroying those rights, ‘it is the right of the people to alter or to abolish’ that government.”
Mustafa Akyol—The Illogic of Globalization as a Scapegoat Everywhere: Who is Taking Advantage of Whom?
“What is ironic in the world today is that conspiracy theorists in different societies are obsessed with the same scapegoat — globalization — but interpret it as a conspiracy only against their side. … In fact, there is a global conspiracy against neither Islam nor the West. Globalization has just forced different societies to interact more than ever — and many people are scared by what they see on the other side. Populists all over the world began taking advantage of those fears, telling us that we should be even more fearful still.”
Roberto Ferdman: 1 in 4 Americans Think Poor People Don’t Work Hard Enough →
Across countries this degree of belief in laziness as a key cause of poverty is unusual.
Election Day Special, 2016
On this US Election Day, 2016, I will be flying from Israel, where I gave two talks at the Bank of Israel, to Brussels, where I am a keynote speaker at the annual ECMI conference to be held at the National Bank of Belgium. But I voted by mail before I left on my Fall 2016 tour of European central banks. I hope all of my readers who are US citizens have plans to vote. David Leohnardt in the November 1, 2016 New York Times wrote this:
Voting plans increase voter turnout. In an experiment by David Nickerson and Todd Rogers, involving tens of thousands of phone calls, some people received a vague encouragement to vote. They were no more likely to vote than people who received no call. Other people received calls asking questions about their logistical plans — and became significantly more likely to vote. The questions nudged them.
Second, tell other people about your plan, and ask about theirs. The power of peer pressure increases voter turnout. One aggressive experiment mailed people a sheet of paper with their own turnout history and their neighbors’. A more gentle experiment presented Facebook users with head shots of their friends who had posted an update about having voted. Both increased turnout, as have many other experiments.
You don’t need an intricate effort to influence people, though. Post your own voting plan to Facebook, and ask your friends to reply with theirs. Text or call relatives in swing states and ask about their voting plans. Do the same when you see friends.
And here is Adam Grant in the October 1, 2016 New York Times:
If we want people to vote, we need to make it a larger part of their self-image. In a pair of experiments, psychologists reframed voting decisions by appealing to people’s identities. Instead of asking them to vote, they asked people to be a voter. That subtle linguistic change increased turnout in California elections by 17 percent, and in New Jersey by 14 percent.
The American electorate overall has a great deal of wisdom, but is not able to fully express that wisdom with our current voting system. On that, take a look at last week’s post “Dan Benjamin, Ori Heffetz and Miles Kimball–Repairing Democracy: We Can’t All Get What We Want, But Can We Avoid Getting What Most of Us *Really* Don’t Want?”
October and even November surprises keep coming in for both Donald Trump and Hillary Clinton. One I found interesting was the details David Barstow, Mike McIntire, Patricia Cohen, Susanne Craig and Russ Buettner reported on Donald Trumps tax avoidance approach in the October 31, 2016 New York Times. Essentially, evidence indicates Donald Trump was taking a large deduction on his taxes for his investor’s losses from investing in his project. The way he did that was by overvaluing partnership equity in the failed projects and purporting to reimburse his investors for their losses by giving them overvalued partnership equity. What I wasn’t totally clear about is whether these investors succeeded in deducting from their own taxes the very same losses, using a lower value of that partnership equity received that was inconsistent with the value that Donald Trump used. That is, did Donald Trump take his investor’s loss deductions away from them, or did he and his investors both successfully claim the same losses?
Finally, let me mention that a key issue in this election is the principle of the equality of all human beings, an issue I discussed in “Us and Them” and this past Sunday in “John Locke on the Equality of Humans.”
How Negative Rates are Making the Swiss Want to Pay Their Taxes Earlier

In “Swiss Pioneers! The Swiss as the Vanguard for Negative Interest Rates” I wrote:
there is no question that negative interest rates will require many detailed adjustments in how banks and other financial firms conduct their business. Like it or not, Swiss banks and the rest of the Swiss financial industry may be forced to lead the way in figuring out these adjustments, just as the Swiss National Bank is leading the way in figuring out how to conduct negative interest rate policy. The Swiss are eminently qualified for that pioneering role. The rest of the world would be well-advised to watch closely.
Some of the adjustments that need to be made in a negative rate environment are to the tax system. Recently, Swiss cantonal governments and the Swiss federal government have realized they can lower incentives for early tax payments, since low interest rates on other accounts provide an incentive to pay taxes early. Here are the two passages I found most interesting for the details reported:
Although Swiss retail banks have largely shielded ordinary bank customers from negative interest rates, companies face penalties for holding large amounts of cash. That has increased the appeal of incentives traditionally offered by Swiss cantons as well as the federal government for early tax payments.
Companies entitled to tax rebates had also waited to reclaim funds from the state, the finance ministry in Bern said. …
The federal government is not only enjoying a boost to its finances [from negative interest rates on its bonds up to a 20-year maturity]. It does not have to worry about paying charges on cash accounts either: it is specifically excluded from the negative interest rates imposed by the SNB, which acts as its banker.
All of these issues were quite predictable, but it is fascinating to see them actually playing out. This example is important because it indicates that some of the steps necessary to eliminate the zero lower bound that are not within the authority of central banks might be handled in a reactive way by other arms of government.
Thanks to Ruchir Agarwal for pointing me to this article.
John Locke on the Equality of Humans
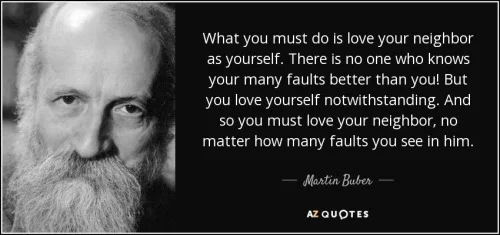
There are many dimensions of the principle of equality among humans. The most difficult is expressed by the Biblical command “Love your neighbor as yourself” (Leviticus, 19:18; Matthew 22:39). The Martin Buber quotation above points to some of the bias toward self that would have to be overcome to actually obey this command.
A much more modest demand is to treat the interests and concerns of two humans that come before you for judgment equally. This idea provides part of the context for the Levitical command “Love your neighbor as yourself.” Three verses earlier, Leviticus reads:
You shall do no injustice in court. You shall not be partial to the poor or defer to the great, but in righteousness shall you judge your neighbor. (Leviticus 19:15)
Of course, a key question, as I put it in “Us and Them” is “whose well-being counts: who is in the charmed circle of people whose lives we are concerned about and who is not.” Jesus was asked almost exactly this question by a student of the Law of Moses who knew his Leviticus well:
And, behold, a certain lawyer stood up, and tempted him, saying, Master, what shall I do to inherit eternal life? He said unto him, What is written in the law? how readest thou? And he answering said, Thou shalt love the Lord thy God with all thy heart, and with all thy soul, and with all thy strength, and with all thy mind; and thy neighbour as thyself. And he said unto him, Thou hast answered right: this do, and thou shalt live. But he, willing to justify himself, said unto Jesus, And who is my neighbour? (Luke 10:25-29)
Jesus answered by telling the story of the Good Samaritan–a despised outsider who was kinder to a man beaten by thieves than those of his own ethnicity. The rhetorical force of the Good Samaritan story, as I see it, is that someone who is kind to all human beings seems nobler than someone so ready to draw a line between the people who count and those who don’t that a few lines later the charmed circle of those who count has contracted perilously close to being a circle enclosing a single ego.
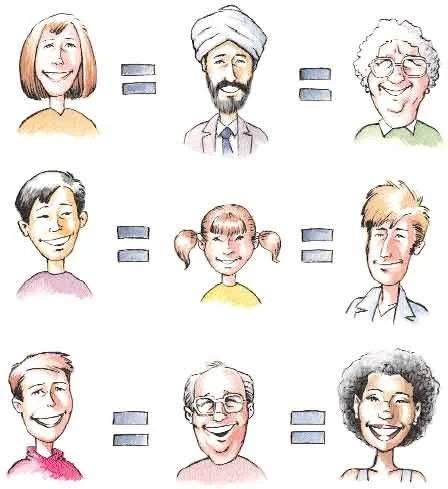
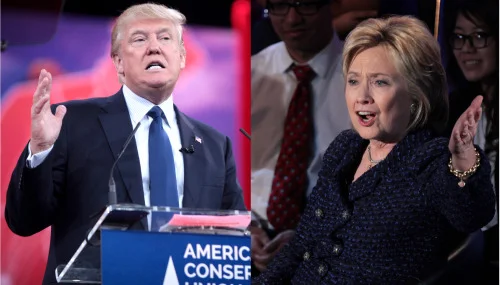
Not just equal concern for the welfare of those in outgroups, but any significant concern for those in outgroups is very much still at issue in the modern world. The second figure above doesn’t plumb the full depth of unconcern for outgroups that we are still wrestling with. Take as given for the sake of argument that the welfare of citizens ought to count in political decision-making more than the welfare of non-citizens. It then makes a huge difference whether the welfare of non-citizens counts zero or counts at a fraction–say one-hundredth as much as the welfare of citizens. Why? Because as a practical matter there are many policies that raise the welfare of citizens a tiny bit, or seem to, but without doubt grievously hurt the welfare of non-citizens.
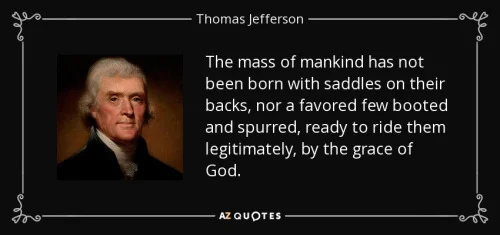
The dimension of equality most directly relevant for political philosophy is the one pointed to by Thomas Jefferson in the third figure above. There is not some person or group of people who have the inherent right to be rulers. Although this is the type of equality that John Locke needs most to make his argument in his 2d Treatise on Government:“On Civil Government,” he begins with the stronger “Love your neighbor as yourself” version of equality, pointing in section 5 to the theology of Richard Hooker:
This equality of men by nature, the judicious Hooker looks upon as so evident in itself, and beyond all question, that he makes it the foundation of that obligation to mutual love amongst men, on which he builds the duties they owe one another, and from whence he derives the great maxims of justice and charity.
John Locke then quotes Richard Hooker as follows:
The like natural inducement hath brought men to know that it is no less their duty, to love others than themselves; for seeing those things which are equal, must needs all have one measure; if I cannot but wish to receive good, even as much at every man’s hands, as any man can wish unto his own soul, how should I look to have any part of my desire herein satisfied, unless myself be careful to satisfy the like desire, which is undoubtedly in other men, being of one and the same nature? To have any thing offered them repugnant to this desire, must needs in all respects grieve them as much as me; so that if I do harm, I must look to suffer, there being no reason that others should shew greater measure of love to me, than they have by me shewed unto them: my desire therefore to be loved of my equals in nature, as much as possible may be, imposeth upon me a natural duty of bearing to them-ward fully the like affection; from which relation of equality between ourselves and them that are as ourselves, what several rules and canons natural reason hath drawn, for direction of life, no man is ignorant. Eccl. Pol. Lib. i.
How is it that we human beings have the concept of human equality at all? I don’t know. But I have the sense that the way we see other human beings when we look at a crowd of strangers we know nothing about, who are all of a relatively homogeneous social group, has a lot to do with it. Because we have “theory of mind”–including a model in our own heads of how things appear to other people–we know that each of us, too, could seem like just a face in a crowd. That picture of just another face in a crowd is a starting point for conceiving of human equality.
Prominent Exoplanet Researcher Found Guilty of Sexual Harassment →
Unacceptable behavior by Geoff Marcy. Being a good scientist doesn’t give anyone a pass to make other people’s lives miserable in this way.
On sexual harassment in science, also see Hope Jahren’s New York Times article “She Wanted to Do Her Research. He Wanted to Talk ‘Feelings.’” And John Johnson, in “Fed Up With Sexual Harassment: Defining the Problem” on the Women in Astronomy blog writes this:
If you are a man and struggle to see why an unwelcome sexual advance can be so disturbing, take my friend’s suggestion and ignore the gender mismatch. Instead of imagining a senior woman touching you, imagine a large, muscular man gazing seductively into your eye while touching your knee just before colloquium. How well would you remember the talk? What would be on your mind following the talk? Who would you talk to about the incident, especially if the man who has a crush on you has control over your career?
Division of Labor in Track-and-Hook Songwriting
“In country music, the melody-and-lyrics method is still the standard method of writing songs. (Nashville is in some respects the Brill Building’s spiritual home.) But in mainstream pop and R&B songwriting, track-and-hook has taken over, for several reasons. For one thing, track-and-hook is more conducive to factory-style song production. Producers can create batches of tracks all at one time, and then e-mail the MP3s around to different topliners. It is common practice for a producer to send the same track to multiple topliners—in extreme cases, as many as fifty—and choose the best melody from among the submissions. Track-and-hook also allows for specialization, which makes songwriting more of an assembly-line process. Different parts of the song can be farmed out to different specialists—verse writers, hook smiths, bridge makers, lyricists—which is another precedent established by Cheiron. It’s more like writing a TV show than writing a song. A single melody is often the work of multiple writers, who add on bits as the song develops. …In a track-and-hook song, the hook comes as soon as possible. Then the song ‘vamps’—progresses in three- or four-chord patterns with little or no variation. Because it is repetitive, the vamp requires more hooks: intro, verse, pre-chorus, chorus, and outro hooks. ‘It’s not enough to have one hook anymore,’ Jay Brown explains. ‘You’ve got to have a hook in the intro, a hook in the pre, a hook in the chorus, and a hook in the bridge, too.’ The reason, he went on, is that ‘people on average give a song seven seconds on the radio before they change the channel, and you got to hook them.’”
Dan Benjamin, Ori Heffetz and Miles Kimball—Repairing Democracy: We Can’t All Get What We Want, But Can We Avoid Getting What Most of Us *Really* Don’t Want?
The 2016 US presidential election is noteworthy for the low approval ratings of both major party candidates. For example, as of November 2, 2016, poll averages on RealClear Politics show 53.6% of respondents rating Hillary Clinton unfavorably, while only 43.9% of respondents rate her favorably; 58.9% of respondents rate Donald Trump unfavorably, while only 38.1% of respondents rate him favorably. Leaving aside those who vote for a minor party or write-in candidate, there is no question that on election day, many voters will think of what they are doing as voting against one of these two candidates rather than voting for one of them.
Out of all the many candidates who campaigned in the primaries to be President of the United States, how did the electoral system choose two who are so widely despised as the candidates for the general election? The party system for choosing the candidates for the general election may bear some of the blame, especially in an era of high political polarization. But another important characteristic of the current US electoral system is that one can only make a positive vote for a candidate, not a negative vote. That is, in the current voting system, voters can only express one attitude towards a candidate—the belief that she or he would make the best president among the candidates. But, should this be the only attitude that comes into play when picking the most powerful person of the free world? Shouldn’t our voting system give voters a chance to say which candidate they think would make the worst president before we deposit the U.S. nuclear codes in a new president’s hands? And more generally, shouldn’t our voting system take into account how much voters like or dislike the candidates?
Our work on collective decision-making mechanisms for incorporating subjective well-being data into policy-making led us to stumble on a class of voting systems for multicandidate elections that we think might help in avoiding outcomes that a large share of people hate. For us, this research program began with “Aggregating Local Preferences to Guide Marginal Policy Adjustments” (pdf download) by Dan Benjamin, Ori Heffetz, Miles Kimball and Nichole Szembrot in the 2013 AEA Papers and Proceedings. More recently, “The Relationship Between the Normalized Gradient Addition Mechanism and Quadratic Voting” by Dan Benjamin, Ori Heffetz, Miles Kimball and Derek Lougee (on which Becky Royer worked as an extremely able research assistant) draws some connections between what we have come to call the “Normalized Gradient Addition (NGA) mechanism” and a broader literature. (Here is a link to a video of my presentation on that paper.)
Figure 1: Voting Diagram for Three Candidates

To better understand the NGA mechanism as applied to multicandidate voting, consider the simple case in which there are three candidates – Tom, Dick, and Jerry – as shown in Figure 1 above. In this case of multicandidate voting, we represent how close each candidate is to winning by a point in a triangle. The three vertices represent victory for one particular candidate, while the edges opposite a vertex represent that candidate being eliminated. The distance from each edge can be thought of as a kind of “notional probability” that a particular candidate would win if the selection process were somehow cut short and terminated in the middle of the action. Thus, the points in the interior of the triangle represent an unresolved situation in which each candidate is still treated as having a chance. Voters can choose vectors of a fixed unit length in any direction within the triangle. The current position in the triangle then gradually evolves in a direction determined by adding up all of these vector votes.
To illustrate, In the picture on the left of Figure 1, there is a blue arrow pointing from the starting point upwards towards Dick. This is the only movement that our current voting system allows for; a positive vote for one candidate. But there is also the red arrow, pointing in the opposite direction. This corresponds to a “negative” vote, in which the voter’s only goal is to vote against Dick. Not only would our mechanism allow for both these positive and negative votes, but it would allow voters to have even more complex votes based on their specific preferences for each of the candidates, as indicated by all of the arrows in the picture on the right. This example can be extended to higher dimensions, in which there are more than three candidates. For example, the policy space would be modeled as a tetrahedron for four candidates, or a simplex for five or more candidates, with a vertex for each candidate.
Figure 2: Summing the Votes and Adjusting the Position in the Triangle

From these preference vectors, we can then add up the vectors across people to determine the direction in which the position in the triangle evolves. Figure 2 above depicts an example of a simple two-voter system. In this example, person 1’s vector points most closely towards Jerry, while person 2’s vector points most closely towards Dick. After summing these two vectors, a small number times the resulting vector is added to the previous point in this triangle to get a new point. If that new point is outside the triangle, then the closest point on the boundary of the triangle is the new position instead. This procedure is then repeated until either a vertex is reached (decisive victory for one candidate) or all motion grinds to a halt because the votes exactly counterbalance one another.
It is important to note that we would not need or expect all voters to understand this triangular representation of the voting mechanism. Our focus is on designing a survey that lets individuals easily provide the information needed to calculate the direction a particular voter would most like to go, without them having to know this representation of their vote explicitly.
The voting process is a matter of giving a rating to each candidate on a scale from 0 to 100, where 0 is the rating for the least favored candidate and 100 is the rating for the most favored candidate. Giving a rating to each candidate allows a voter the options of:
a straight “positive” vote, by rating the most favored candidate 100 and all other candidates 0,
a straight “negative” vote, by rating the least favored candidate 0 and all other candidates 100,
anything in between a straight positive and a straight negative vote, by rating the least favored candidate 0, the most favored candidate 100 and other candidates in between.
Data Collection
In order to illustrate the process of having voters rate candidates, and investigate what type of votes people wanted to cast, we collected data on the University of Southern California’s Understanding America Study, between March 18 - 21, 2016, on preferences over the last five major party candidates standing at the time (Hillary Clinton, Ted Cruz, John Kasich, Bernie Sanders, and Donald Trump).
We asked participants who they believed would make the best President of the United States out of the five candidates, and then asked them who would make the worst. We set their “best” candidate at a rating of 100 and their “worst” candidate at a rating of 0. We had two different approaches for having each individual rate candidates after this point.
In our first approach, we simply asked participants to “rate the other candidates using a special scale, where [worst candidate] is a 0 and [best candidate] is a 100”, with no other instructions. Let’s refer to this approach as “unstructured ratings.”
In our second approach, we seek to elicit participants’ expected utilities for each candidate. That is, we want to identify how much each participant would value having each candidate as president compared to the other candidates. In doing so, we explained that choosing a rating X on the scale indicates that the participant feels indifferent between the following two situations: (1) knowing for sure that the candidate they are rating will be president, and (2) waking up on election day with their favorite candidate having an X% chance of winning and their most disliked candidate having a (100-X)% chance of winning. Figure 3 is a screenshot of the directions each participant received in this approach, including two examples for clarity, in which the voter had chosen Donald Trump as the “worst” candidate and Hillary Clinton as the “best” candidate.
Figure 3: Instructions for Expected-Utility Ratings

A priori we favor the expected-utility ratings over the unstructured ratings, but we will report results using the unstructured ratings for those who don’t share that view and to show that it matters what instructions were given regarding how to use the scale.
Converting the Ratings Into Votes
In the simplest, most straightforward implementation of the NGA mechanism, we construct each individual’s vector vote from their ratings as follows:
Calculate the individual’s mean rating across all five candidates and the standard deviation of the individual’s ratings.
For each candidate, starting with the individual’s rating of that candidate, subtract the individual’s mean and divide by the individual’s standard deviation.
This procedure normalizes an individual’s candidate ratings to have mean zero and variance one. That way, the vector vote of each individual is ensured to be of length one. Although there are other strategic voting issues we will return to below, the normalization prevents anyone from having more influence than other voters simply by giving all extreme ratings (all 0’s or 100’s). We refer to this restriction—equivalent to the vector in the triangle, tetrahedron or simplex representation having a maximum length of 1–as the “variance budget.” That is, each voter has a restricted amount of variance in their normalized vector, so in effect, voters cannot express a stronger opinion about one candidate without having to express less strong opinions about other candidates. Visually, this “budget” ensures that each voter’s preference vector is of the same length in figures 1 and 2.
The normalized ratings having a mean of zero represents something even more basic: since only one candidate will win in the end, one cannot raise the chances of one candidate without lowering the chances of at least some other candidates.
To us, there is an intuitive attraction to focusing on normalized ratings, even apart from the NGA motivation that led us to that focus. So we will use the normalized ratings extensively in our empirical analysis of the data.
Analyzing the Data
Who Would Win? The first question to ask of the data is who would have won? First, let’s see who would have won in our sample using the current voting system. We assume that participants vote for the candidate that they chose as the “best” candidate. Tables 1 and 2 show these results, broken up by unstructured and expected utility ratings. We see that in both types of ratings, Hillary Clinton outperforms the other candidates. Note that at this stage in the survey, both types of ratings ask the same question (“who would make the best candidate”), so it is expected that the results would be similar.
Table 1: Number of “best” candidate ratings using unstructured ratings

Table 2: Number of “best” candidate ratings using expected utility ratings
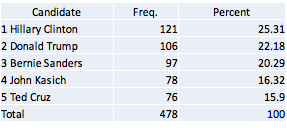
From these results, we see that Hillary Clinton would be the nominated Democrat in both rating types, and Donald Trump would be the nominated Republican in our sample. Of those two remaining candidates, our sample of participants would elect Hillary Clinton, with 459 participants who prefer her, over Donald Trump, with 325 participants who prefer him.
Now, let’s look at how these results would change if we consider NGA as a multicandidate voting mechanism, as previously described. In the simplest, most straightforward implementation of NGA for a multicandidate election, the victor is the candidate with the greatest sum of normalized ratings across voters. (Note that it is possible to repeat the process of adding a small vector based on the same information. Typically, this will lead first to a side or edge—one candidate being eliminated—and then to a vertex, one candidate being victorious.)
As a prediction of what would happen in an actual multicandidate election using NGA, the results from our data need to be taken with a large grain of salt for at least three reasons. First, our survey was conducted months before November 8, when voters’ knowledge of the five candidates was still relatively limited—not to mention in an election cycle with lots of dramatic “October surprises.” Second, the total number of survey respondents is relatively small, and our survey respondents are not fully representative of the actual population of voters, though every effort was made to make the UAS survey as representative as possible of the adult US population overall. And third, our survey respondents knew that their answers to our survey would not determine who would become president, and so they were not subject to incentives for strategic misreporting that would arise in a real-world multicandidate election using NGA. But that makes the data even more interesting as an indication of which candidate would have been most acceptable to a wide range of voters. Here are averages of the normalized ratings for both the sample that was asked to give unstructured ratings and the sample that was asked to give expected-utility ratings:
Table 3: NGA Results Using Unstructured Ratings

Table 4: NGA Results Using Expected Utility Ratings

Thus, leaving aside any effects from strategic voting (and ignoring for the moment the timing of our survey and the non-representativeness of our sample), our data point to John Kasich as most likely to have won the election using NGA to resolve the multicandidate choice over all of these five candidates. While his mediocre performance under our current voting system suggests that he was not the favorite candidate of all that many voters, our respondents overall found him relatively acceptable.
Bernie Sanders has the second-to-highest average rating, despite not performing very well in the primary. Donald Trump has the lowest average rating by far, with Ted Cruz second-to-lowest using the unstructured ratings and Hillary Clinton second-to-lowest using the expected-utility ratings. The most interesting point to take away is that, by the expected utility ratings, out of these five candidates, the current general election has come down to the two candidates with the lowest average ratings. (This is in line with the low approval ratings for both Donald Trump and Hillary Clinton.)
Expected-Utility Ratings vs. Unstructured Ratings. A striking difference between the expected utility ratings and the unstructured ratings is the greater prevalence of tendencies toward lower normalized ratings with the expected utility ratings.
One way to illustrate this difference is to look at scatterplots of the most extreme rating (in absolute value) in the normalized ratings vs. the second most extreme rating in the normalized ratings. In figures 4 and 5 below, we can see whether participants’ most extreme preferences were for a certain candidate (indicated by points with a positive x value) or against a certain candidate (indicated by points with a negative x value).
Figure 4: Most Extreme vs. Second Most Extreme Ratings Using Unstructured Ratings

Figure 5: Most Extreme vs. Second Most Extreme Ratings Using Expected Utility Ratings

Out of the expected-utility vector votes, 345 have the most extreme normalized rating negative, compared to 133 that have the most extreme normalized rating positive. By contrast, out of the unstructured vector votes, 211 have the most extreme normalized rating positive, compared to 120 that have the most extreme normalized rating negative. This trend suggests that participants emphasize their negative feelings toward candidates more in the expected utility ratings as compared to in the unstructured ratings.
This stark contrast between the expected utility ratings and the unstructured ratings can further be seen through the notable differences in the shape of the distribution between these two types of ratings. Skewness describes respondents’ tendencies to rate some candidates much higher than average (skewness > 0) in comparison to the standard deviation of 1 or much lower than average (skewness < 0). Intuitively, a set of ratings with a positive skewness is somewhat closer to being a “positive” vote, while a set of ratings with a negative skewness is somewhat closer to being a “negative vote.” Figure 6 shows that in the unstructured ratings, skewness tends to be more positive than in the expected utility ratings. Table 5 gives summary statistics corresponding to this graph. This indicates that respondents are closer to casting “positive” votes in the unstructured ratings. The expected utility ratings, on the other hand, tend to have a more negative skew, and are thus closer to being “negative” votes. Table 5 emphasizes this point, by showing that the average skew for unstructured ratings is indeed positive, while the average skew for the expected utility ratings is strongly negative.
Figure 6: Skewness of Unstructured vs. Expected Utility Ratings

Table 5: Skewness of Ratings

Thus, by both this measure of skewness and by the extreme ratings plots, the expected-utility ratings look closer to being negative votes (votes against a candidate) while the unstructured ratings look closer to being positive votes (votes for a candidate).
Why Are the Expected-Utility Ratings So Different from the Unstructured Ratings? A solid answer to the question of why the expected-utility ratings are so different from the unstructured ratings (and the related question of whether our a priori preference for the expected-utility ratings is justified empirically) would require additional data in another multicandidate election. But we are able to provide one hypothesis. Because our data were collected in the heat of the primaries, our respondents may have wanted to use the ratings to express their opinions about those primary battles, using a substantial portion of the 0 to 100 scale to express those opinions, and consequently squeezing down the amount of the scale left to express their opinions about the candidates in the party they favored less. The structure of expected-utility ratings would have pushed back against this tendency, asking the respondents, in effect, “Are you really willing to accept a substantial chance of your least favorite candidate winning in order to get your favorite candidate instead of your second- or third-choice?”
To see if this hypothesis is at all consistent with the data, consider the variance among an individual’s two or three ratings within the party of that individual’s favorite candidate. Tables 6 and 7 show that the within-party, within-voter variance is substantially greater for the unstructured ratings than for the expected utility ratings. This lends some support to the idea that those answering the unstructured ratings were more focused on the primaries, overstating their dislike for the “other” candidate(s) in the party, whereas in the expected utility ratings, participants were more likely to think about the general election and save more of the unit variance in normalized ratings for candidates in the other party.
Table 6: Among those whose top candidate was a Democrat, what was the average variance between Clinton and Sanders ratings?

Table 7: Among those whose top candidate was a Republican, what was the average variance between Cruz, Kasich, and Trump ratings?

Multiple-Stage NGA Voting.
In the current voting system, strategic voting for someone other than one’s most preferred choice is a commonplace. So there is no reason to dismiss a new voting system for having some degree of strategic misreporting. But to allow voters the simplicity of truthful reporting in their ratings without hurting themselves too much, we view it as desirable to have the incentives for strategic misreporting be relatively small. Given the issues taken care of by the normalization of the ratings, the incentive for strategic misreporting we have worried most about is the incentive to avoid giving a strong negative rating to a candidate who is going to be eliminated anyway, since doing so would dilute the ratings assigned to other candidates. That is, there is an incentive to free ride on the elimination of widely disliked candidates. Fortunately, modifications of the NGA mechanism can help reduce this incentive or help insure reasonable results despite some degree of strategic voting.
One modification of the NGA mechanism helpful in dealing with free riding in the elimination of widely disliked candidates is to vote in stages. Rather than taking ratings at one point in time to guide movement all the way to a vertex with one candidate winning, one can have a series of nonpartisan “open primaries” in which the notional probabilities of a candidate winning if things were ended prematurely are adjusted some distance, but not all the way to one candidate winning. This gives voters a chance to see if a candidate many thought would be quickly eliminated is doing well, making it worthwhile spending some of one’s variance budget voting against them in the next stage. On the other hand, taking the ending point of the adjustments in notional probabilities from the nonpartisan open primary as the starting point for the next stage ensures that all voters have some reward for the voting efforts they make, even in the first stage.
Having multiple stages also serves other purposes. There could easily be candidates in an initially crowded field that voters simply don’t know much about and don’t want to invest in learning about because it seems those candidates have no chance. A nonpartisan open primary helps voters and journalists know which candidates are worth learning more about.
(Also, one practical issue with the early “primaries” is the large number of candidates a voter might be asked to rate. One way to handle this is to include an option for casting a straight positive or straight negative vote that effectively fills in 0’s and 100’s for all the candidates accordingly.)
A Smoothed-Instant-Runoff Version of NGA for Multicandidate Elections
The NGA perspective from which we are looking at things suggests another, more technical way to reduce the incentive for strategic misreporting: using exactly the same kind of survey to elicit expected-utility ratings, but modifying the mechanism so that it automatically deemphasizes the ratings of candidates who are on their way out. This involves (a) demeaning using a weighted average that gives a low weight to candidates that have a currently low notional probability of winning, (b) slowing down (without stopping) the adjustment of notional probabilities that are already low, and (c ) steering vector votes toward focusing on candidates that still have a relatively high notional probability. There is a parameter that determines whether these three things happen only when the notional probability of a candidate is very low or more gradually. If these modifications happen only when the notional probability of a candidate is very low, the mechanism becomes a combination of the simplest implementation of NGA and the idea behind instant-runoff voting, where voters re-optimize once a candidate is eliminated. With less extreme values of the parameter, the spirit of instant-runoff voting is smoothed out. Regardless of that parameter, the basic NGA idea is preserved.
A downside of the smoothed-instant-runoff version of NGA for multicandidate elections is its complexity. It would still be fully verifiable, but those who do not fully understand it might be suspicious of it. Nevertheless, to the extent it makes one aspect of strategic voting happen automatically without strategic misreporting, it would put less sophisticated voters more on a par with the more sophisticated voters.
Incentives for Politicians
A great deal of research is needed to fully understand incentives for politicians under an NGA or Smoothed-Instant-Runoff NGA multicandidate voting system with multiple stages. However, we are willing to make some conjectures. If people view certain important candidates of an opposing party as “the devil,” the strong negative ratings for those “diabolical” candidates would open up an opportunity for centrist candidates like John Kasich whom few voters see as “diabolical.” It could even open up space for new centrist parties.
Undoubtedly there are other effects that are harder to foresee, but a system that allows people to express strong negative views about a candidate should help avoid many possible bad outcomes. And the NGA system still allows people to express strong positive views about a candidate if they so choose.
NOTE: Please consider this post the equivalent of a very-early-stage working paper. We would love to get comments. And just as for any other early-stage working paper, we reserve the right to copy wholesale any of the text above into more final versions of the paper. Because it is also a blog post, feel free to cite and quote. We want to thank Becky Royer for outstanding research and editorial assistance.