Brian Flaxman: Yes! Economics Did Sway Obama Voters to Trump
Source: Brian.Flaxman@colorado.edu
Brian Flaxman is a student in the Economics PhD program at the University of Colorado Boulder where I am now a professor. He identified a very interesting set of facts about the presidential election that put Donald Trump in the White House. Email Brian with any questions (Brian.Flaxman@colorado.edu). From here on, I'll let Brian speak for himself:
Tuesday, November 8, 2016 is the day that Donald Trump was elected 45th President of the United States. Many people across the country believed that Hillary Clinton’s victory was all but inevitable, adding to the shock and surprise of this momentous event. Because of this, there has been a massive effort underway to try to understand how he could have won. One main school of thought is that Trump’s victory can be mostly contributed to right wing identity politics. The other is that there have been many people in the country who have struggled economically, have legitimate grievances with the current political establishment, and found Trump’s populist rhetoric very appealing.
I in no way would make the claim that right wing identity politics didn’t play a role in this election, and doing so would be foolish to say the least. However, not acknowledging the role that the rise in populist fervor played in Trump’s victory would be equally as foolish. There is plenty of circumstantial evidence to support this. Bernie Sanders received over 44% of the Democratic primary vote when facing Hillary Clinton, a mainstay in Democratic politics for the three decades. Now he is the most popular politician in the country according to most polls, including a Harvard-Harris poll released this past week. The Rust Belt, a part of the country that supported Bernie Sanders and Donald Trump in their respective primaries, was likely the part of the country that contributed to Hillary Clinton losing the electoral college.
When discussing the role that economics played in Trump’s win, the main rebuttal is that “The people who voted for Donald Trump never would have voted for a Democrat, regardless of who it was!” Well, that’s a hypothesis that can be scrutinized empirically by looking at election, demographic, and economic data. We can analyze the effect of the Obama to Trump voters, and more importantly, how right wing identity politics and poor economic outcomes contributed to this effect. With the proper data in hand, we can analyze the contributing factors to this shift.
The data I will be analyzing is county level data from both the 2012 and 2016 elections, as well as economic and demographic data from various points, from 2010-2016. I have data from all counties and equivalents not in Alaska. There are several measures that can approximate the support that moved from Obama in 2012 to Trump in 2016, but the one I will focus on I will call Trump’s “share shift”. This is devised from taking the percentage of votes from Donald Trump, and subtracting off Romney and independent and third-party votes. If we were to hold voting populations constant across the 2012 and 2016 elections, this would be the amount that remains would be the Obama voters that switched to Trump. Even though this is almost certainly not the case, it does describe how a county’s overall support moved from Obama in 2012 to Trump in 2016, and provides a good proxy for Obama to Trump voters.
I will be testing the following four indicators of poor economic outcomes:
1. Unemployment year annually from 2016
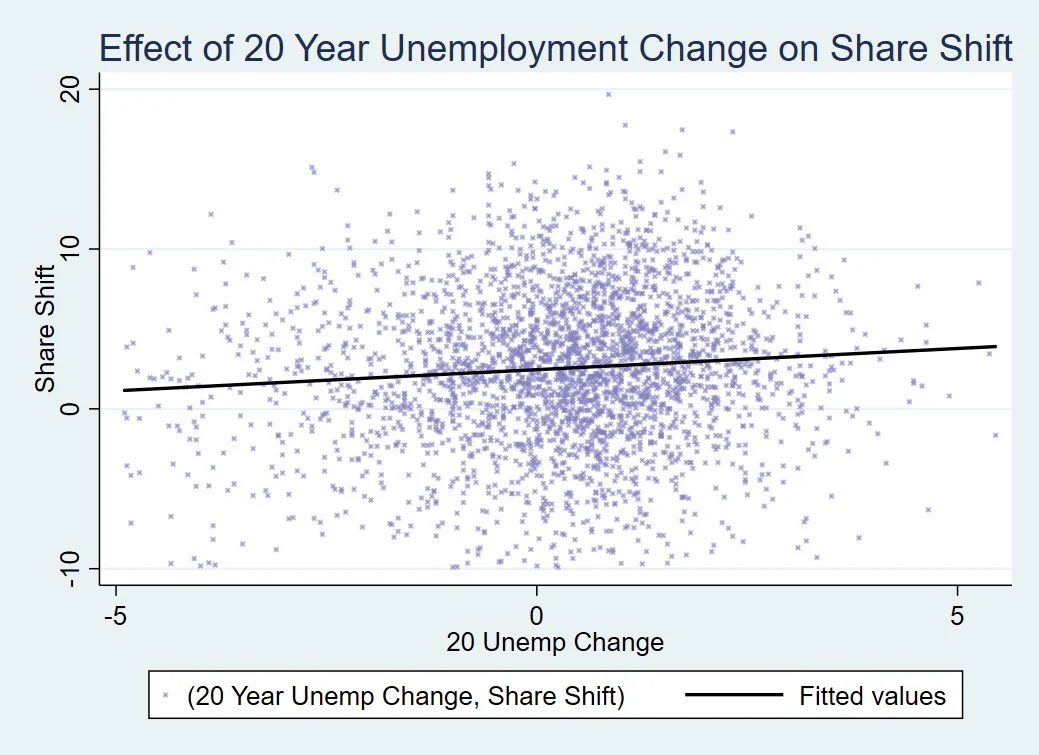
2. Unemployment change over the past 20 years.
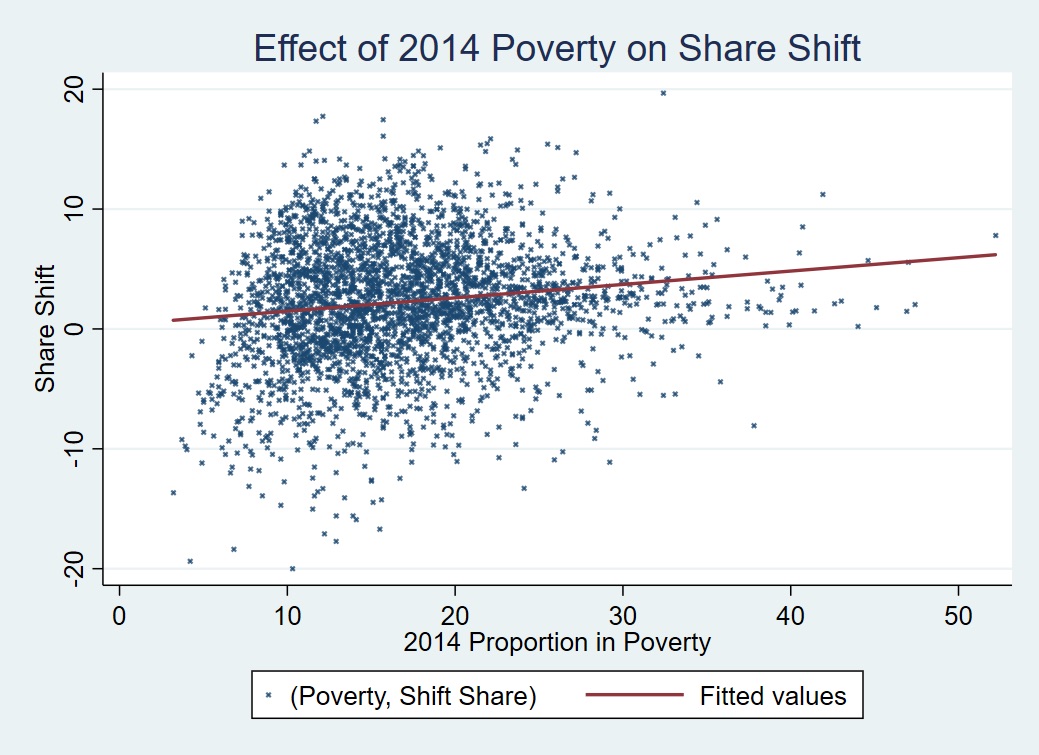
3. Percent living below the poverty line in 2014
4. Loss in overall population from 2010-2014.
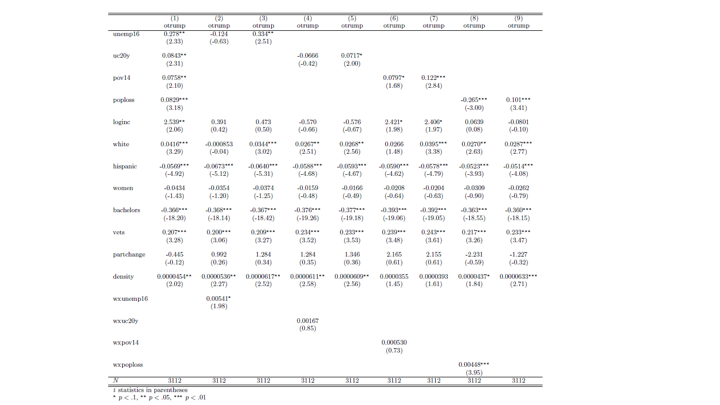
I will test these variables after controlling for white population, Hispanic population, the log of income, female population, population that are veterans, population density, change in voter participation from the 2012 election, and for state fixed effects. Sure enough, negative economic indicators contributed significantly to the shift in votes from Obama to Trump.
When running all four variables at once, they are all positively correlated with share shift, and are all significant with 97% confidence or higher. When each variable is regressed alone with the controls, they are all significant and positively correlated. The cross terms for 2016 unemployment and population loss were both positive and significant in their respective regressions. Furthermore poor economic outcomes are significant when dividing the population into certain subsets, like counties Obama won and the 500 top densely populated counties, and even remained when weighting each county by 2014 population[1].
The conclusion I have reached based on the empirical evidence? Negative economic indicators almost certainly contributed to people shifting away from Obama in 2012 to Trump in 2016, and Trump’s populism was almost certainly one of the factors that helped him win the election.
So how large was the impact of negative economic indicators on per county shift share of votes from Obama to Trump? 2.71% of the vote per county on average. You could say that this doesn’t control for the vastly different sizes in population, except this number only drops to 2.29% percent of the vote when you weight the counties by population, meaning it had a huge impact even when you control for population[2]. The bottom line is that while some of the country’s darker tendencies contributed significantly to Donald Trump being the 45th president of the United States, so too did negative economic outcomes for many voters, contributing in part to the anti-establishment and populist sentiments growing in popularity both here at home and abroad.
Note: If you have trouble reading the tables below, here is a link to the tables in a Word document.


Brian Flaxman