Well-Being Possibility Frontier/Indifference Curves AND The Corresponding Supply and Demand Graphs
WBPF = Well-Being Possibility Frontier (Orange)
Green is for preferences (indifference curves above, demand below)
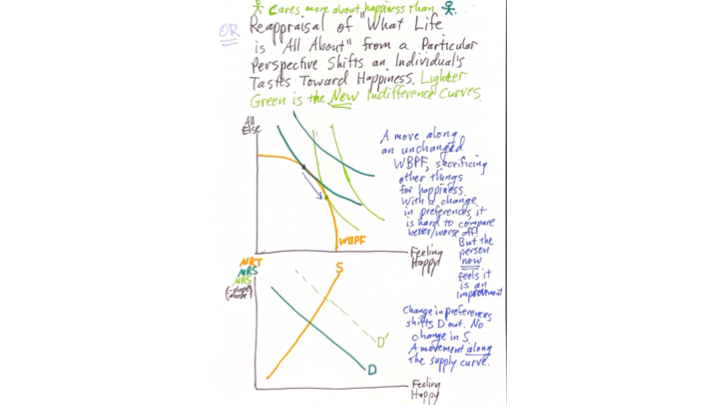
MRT = Marginal Rate of Transformation: the opportunity cost of the other things that must be sacrificed to get one point more of happiness
MRS = Marginal Rate of Substitution: amount of other things the individual is willing to sacrifice to get one point more of happiness
Notes:
The Supply Curve is a graph of minus the slop of the WBPF. It has the level of the highlighted aspect on the horizontal axis and the marginal utility (MU) of the highlighted aspect (which is technically the marginal rate of substitution (MRS) relatve to an amalgam of all other aspects (“all else”).
The Demand Curve is a graph of minus the slope of the indifference curve an individual is on. That means that any shift that puts an individual onto a different indifference curve shifts the demand curve, unless all the indifference curves are parallel vertical shifts of each other (quasi-linearity). That is not a good assumption. The shift of the demand curve occasioned by ending up on a new indifference curve is analogous to income effects on demand for market goods. Because it isn’t literally income, I don’t call these income effects, I call them prosperity effects. The demand curve has the level of the highlighted aspect on the horizontal axis and the marginal rate of transformation (MRT) of “all else” into the highlighted aspect.
Comparative Statics Exercise #1:
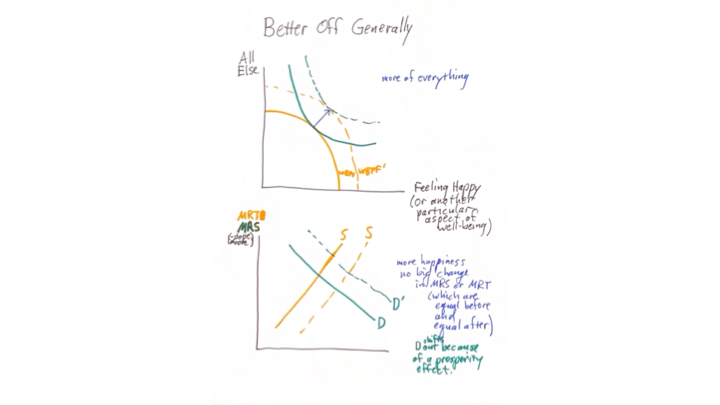
Comparative Statics Exercise #2:
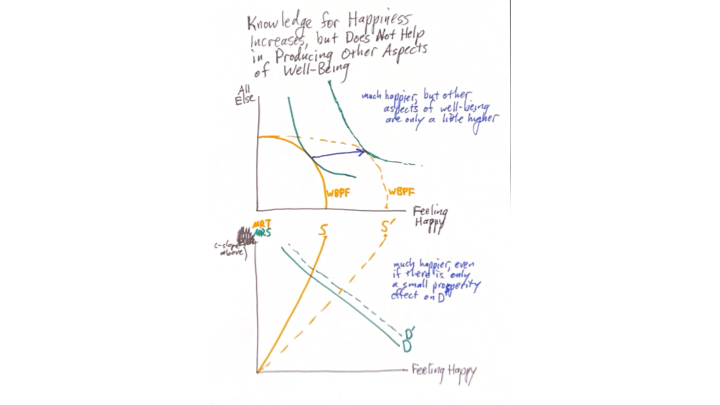
Comparative Statics Exercise
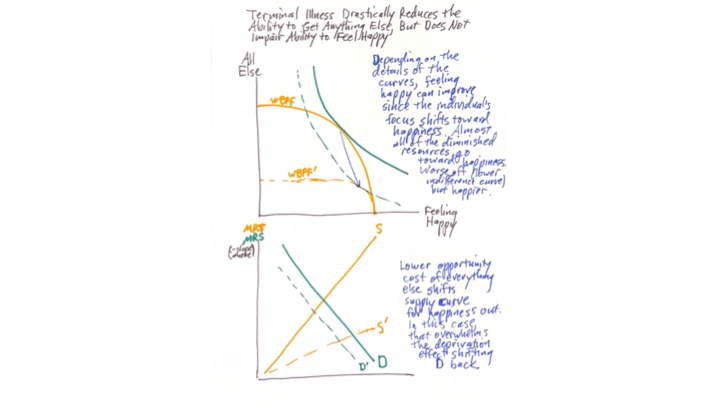
Comparative Statics Exercise #4: