Dimitry Slavin: U.S. Stocks Are Not in a Bubble and Here’s Why

I am quite skeptical of attempts to predict where the stock market overall will go, beyond looking at something like the price/dividend ratio or cyclically adjusted price/earnings ratio a la John Campbell and Robert Shiller, and recognizing moments of market overreaction to geopolitical events. But among those who nevertheless attempt (perhaps foolhardily) to predict, I want to put my “Monetary and Financial Theory” student Dimitriy Slavin in contention. (You can see his Flickr page here, and his LinkedIn page here.) What Dmitriy says sounds at least as sensible to me as others who claim to be able to predict what the market will do–including those with outsized reputations. I’d be interested to hear what people think of his analysis:
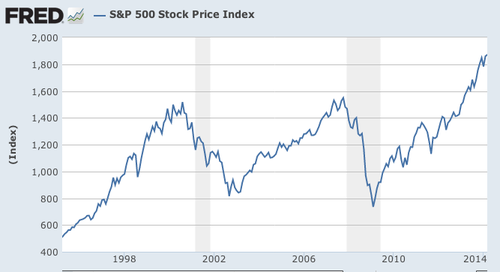
If you take a look at the S&P 500 Stock Index for the past twenty years, you will notice a clear cyclical nature to it- it seems to undergo a cycle about every seven years, with a roughly 5 year period of growth and then a two year period of decline. Five and a half years out of the Great Financial Crisis with the Fed rolling back QE and the S&P index reaching an all time high, some investors are worried that U.S. stocks may be in yet another bubble. In my next two posts, I am going to argue that this is not the case…at least for now.
This weekend I read two interesting documents that have convinced me that it is unlikely we will see a dramatic fall in the S&P anytime soon: JP Morgan’s latest edition ofQuarterly Perspectives and BlackRock’s 2014 Investment Outlook. I will split up my argument into three pieces: (1) Peaks in Stock Prices Vs. Peaks in the Output Gap, (2) Correlation Between the Rise in Stock Prices and the Rise in Corporate Profits, (3) The EV/EBITDA to VIX ratio.
1. Peaks in Stock Prices Vs. Peaks in the Output Gap
One thing that has characterized past asset bubbles is that they generally tend to coincide with peaks in the economic cycle. As we’ve discussed in class, an economy can’t operate above full capacity for long periods of time, so at some point output must fall. In the past, these falls in economic output have occurred at roughly the same time when the stock market fell:
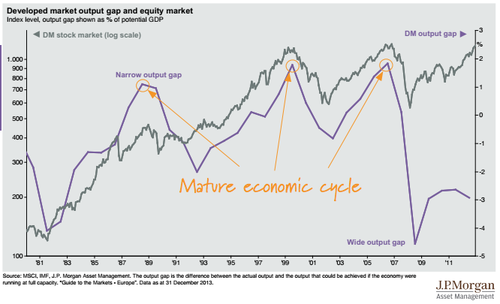
But as you can see by the graph above, the present case is quite different from the past. The output gap is nowhere near a peak right now, and most would agree that the U.S. economy is still in recovery mode from the financial crisis. This recovery has taken much longer than past recoveries from recessions, and has been characterized by slow initial growth, rising incomes, and slowly falling debt burdens. This slow growth coupled with the current negative output gap is a good sign that the U.S. stock market is not on the cusp of another asset bubble.
2. Correlation Between the Rise in Stock Prices and the Rise in Corporate Profits
One thing that characterizes practically all asset bubbles is an unjustified surge in stock prices. What I mean by ‘unjustified’ is that people begin to ignore fundamental analysis and start buying up stocks simply because their price is rising, much like what happened during the Tulip-Bulb Craze we read about in Malkiel’s Random Walk Down Wall Street. In contrast, the recent rise in stock price has not been unjustified because stock prices have been rising along with corporate profits:
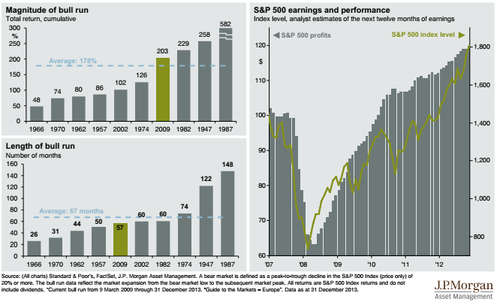
This positive trend gives credence to the argument that investors are not simply building ‘Castles In the Air,’ and rather are basing their investments in sound fundamental analysis. Something to watch out for though is the growth rate of corporate profits versus that of stock prices. I would argue that it is somewhat worrisome that the growth rate in profits for the past three years has been smaller than that of stock prices, and could potentially be a sign that the U.S. stock market will be overvalued in the future. For now though, the difference in growth rates is both tolerable and reasonable.
Taking a look at the left side of the graphic above, we also see that the length of the current bull run is just below the average of past bull runs, yet its return has been slightly higher than average. Roughly average returns + a typical duration time further justify the point that the current bull run on U.S. stocks is not forming an asset bubble.
3. The EV/EBITDA to VIX ratio
The final part of my argument has to do with a common market indicator- the EV/EBITDA ratio- a tool that gives a measures of US corporate valuations, leverage, and investor complacency by dividing enterprise value (EV) by earnings before interest, taxes, depreciation, and amortization (EBITDA). This ratio is then divided by the stock market volatility index in order to measure investor complacency.
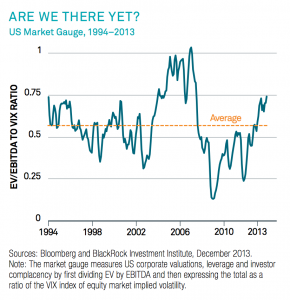
BlackRock’s 2014 Investment Outlook provides a solid interpretation of the above graph:
“The ratio of the [the EV/EBITDA and the volatility index] is the key. High valuations combined with low volatility can make for a lethal mix. This market gauge sounded the alarm well before the financial crisis…[Today,] valuations are roughly in line with their two-decade average (and leverage is lower). Yet volatility is hovering just above two-decade lows. The result: The market gauge stands well above its long-term average,but is far short of its pre-crisis highs.”
The main point the above graph and discussion make is that although we may be seeing early signs of the formation of an asset bubble, it is not expected to form in the imminent future. It also gives further weight to the argument that corporate earnings need to start rising faster if the economy is to avoid a bubble in the future because a rise in earnings would drive the EV/EBITDA to VIX ratio down (assuming volatility stays low).
In summary, I have laid out a three-pronged argument for why I think the U.S. stock market is not experiencing an asset bubble. A wide output gap, a close correlation between earnings growth and stock price growth, and a reasonably small EV/EBITDA ratio tells me that the U.S. economy is not on the cusp of another bubble. Furthermore, I am generally in agreement with Ray Dalio’s claims (mentioned in some of my previous posts, here and here; the first post examines the long term debt cycle and the second elaborates on the last stage of the cycle- the reflationary period) when he asserts that we are currently in the reflationary period of the long-term debt cycle. Consequently, I expect the economy to make a full recovery in the next couple of years: QE tapering will continue, interest rates will rise slowly but steadily, and both corporate earnings and income growth rates will rise, further dispelling doubts of a possible bubble. With all this in mind though, I think it’s important to keep a close watch on the indicators I discussed throughout this post because they provide a good summary for the state of the U.S. stock market.
Update: Robert Flood notes on Facebook:
Just for the record, the Tulip Bulb Craze (1636) was for fixed-date forward bulb prices not spot. I’m not sure what bubbles you are talking about here - no definition - but I’m real sure you are not studying one in some fixed-date forward/futures price.